Displaying APM Stream metrics with Prometheus
You can display APM Stream metrics using these methods.
Displaying data with the Pushgateway dashboard
To display APM Stream data using the Pushgateway dashboard:
-
Make sure the APM Stream service has been running long enough to collect data.
-
Open the <pushgateway-hostname-or-ip>:<pushgateway-port> URL in a web browser.
Example: http://my-push-gw:9091
The Pushgateway dashboard displays raw APM Stream data, similar to this:
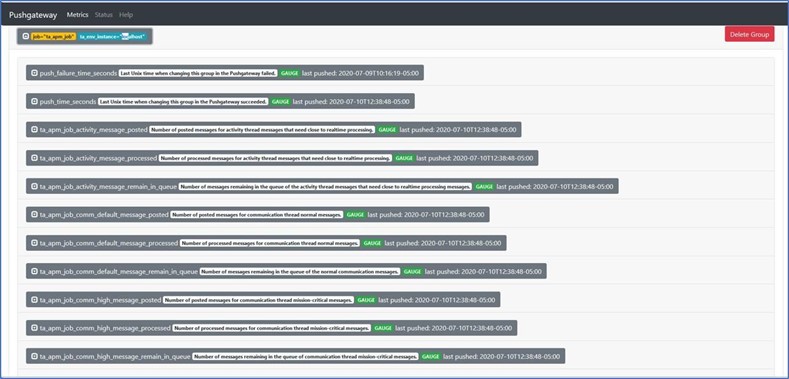
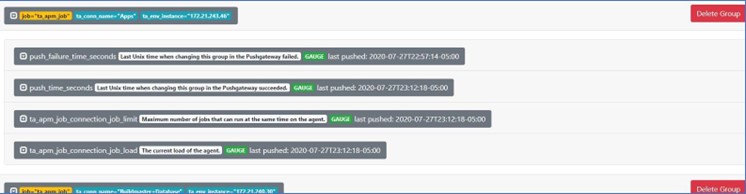
If desired, choose an item to display related messages, similar to this:
Displaying data with the Prometheus dashboard
To display APM Stream data using the Pushgateway dashboard:
-
Open the <prometheus-hostname-or-ip>:<prometheus-port> URL in a web browser.
Example: such as http://my-prom-url:9090.
The Prometheus dashboard displays raw APM Stream data similar to this:
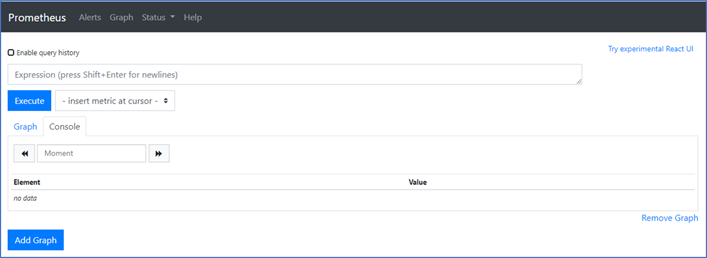
-
Choose the desired metric from the drop-down menu:
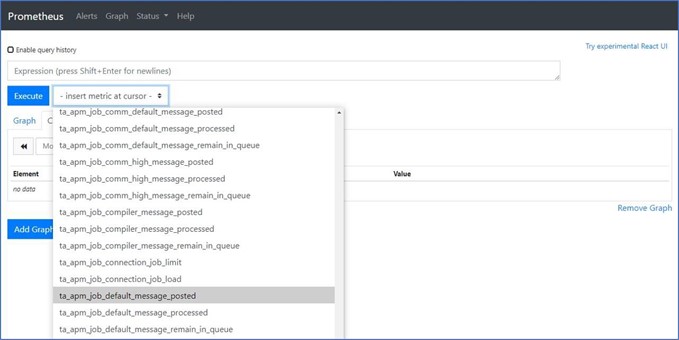
-
Click Execute to display the graph.
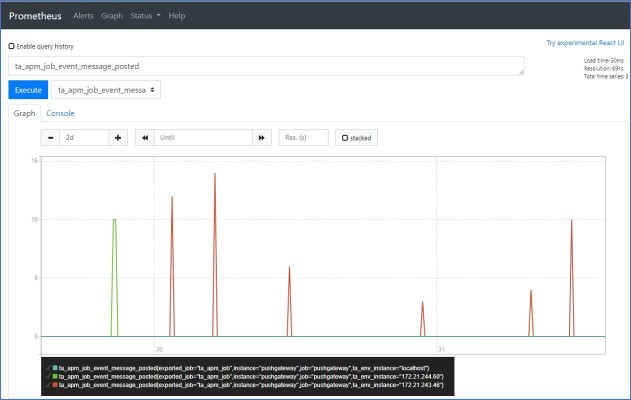
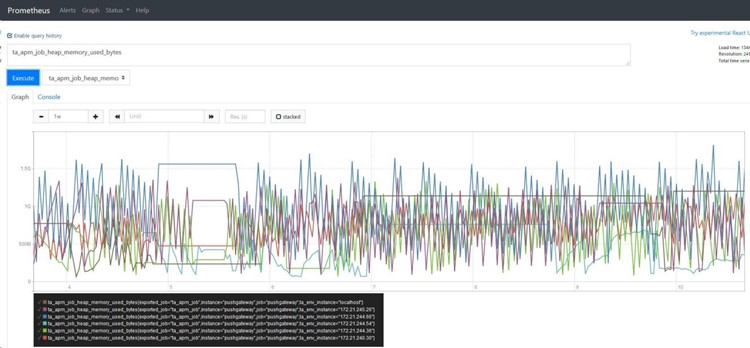
If you chose another metric, such as the ta_apm_job_heap_memory, the graph would look similar to this:
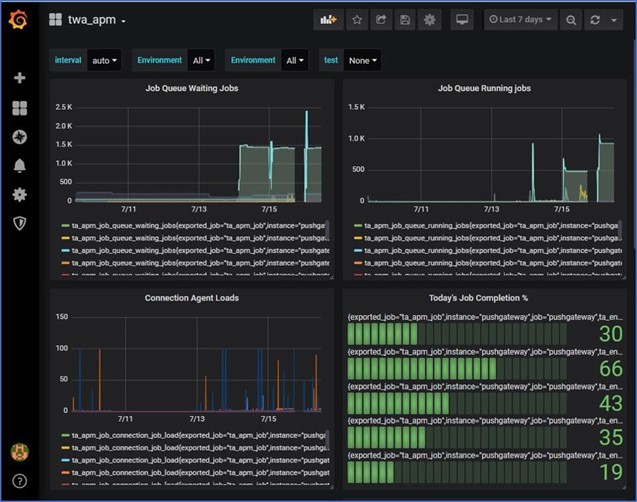
Displaying APM Stream data with Grafana
Grafana is an open source visualization and analytics software application that allows you to represent data visually by creating a dashboard of panels that turn APM Stream data into a collection of graphs and visualizations.
To display APM Stream data using Grafana:
-
Make sure the APM Stream service has been running long enough to collect data.
-
Open the <grafana-hostname-or-ip>:<grafana-port> URL in a web browser.
Example: http://my-grafana:3000.
-
Click a dashboard. The Grafana dashboard displays APM Stream data: