Monitoring and analyzing Data with Prometheus
Prometheus is a monitoring and alerting platform that can consume APM Stream TA metrics in its Pushgateway interface and allows query, visualization, and alerting using Grafana.
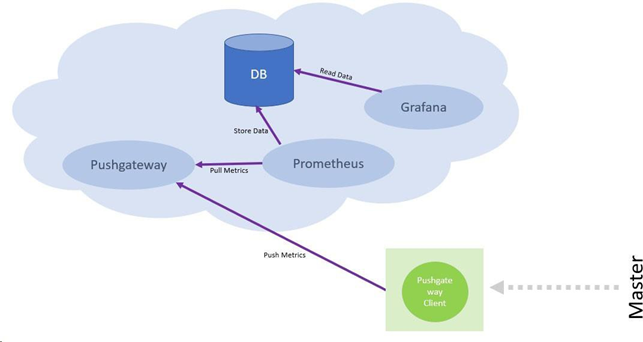
APM Stream sends the metrics to a Prometheus Pushgateway:
-
Agent jobs processing performance (Connection message)
-
Job queue performance (Queue message)
-
Statistics for Master job processing per production day (Statistics message)
-
Duration of job executions (APMJobStatus message)
-
Master queue message thread pool performance (APMQueueHealthMessage message)
-
Server resource and performance (APMServerResource message)
-
Allocation of Master job virtual resources (APMJobResource message)
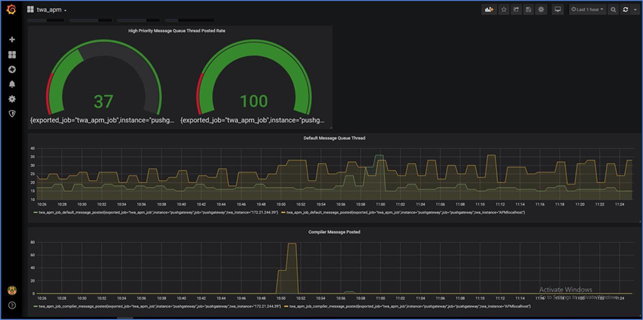
Grafana Dashboard Example: