Monitoring JD Edwards Job Activity
As JD Edwards tasks run as prescheduled or event-based jobs, you can monitor the jobs as you would any other type of job in TA using the Job Details dialog. You can also use Business Views to monitor job activity and view when the jobs are active.
To monitor job activity:
-
Click Operations > Job Activity on the Navigator pane to display the Job Activity pane.
-
Right-click to choose a job and choose Details from the context menu. The Job Details dialog displays.
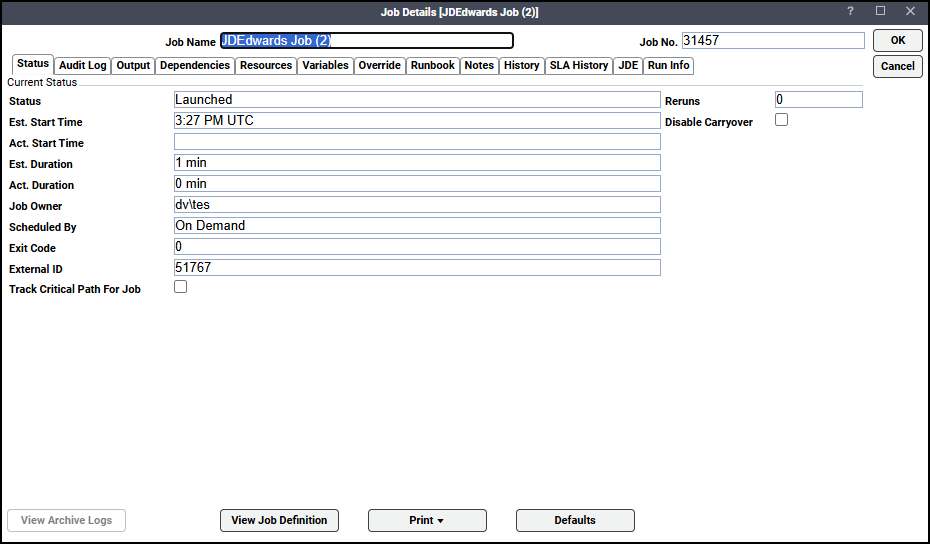
The Status page displays by default. You can view the status of the job, the start and end time, how long it ran, and how it was scheduled. The external ID is the JDEdwards job number.
This tab contains these elements:
-
Status – The job’s current status.
-
Est. Start Time – The estimated job launch time based on its time dependencies and the launch times and estimated durations of preceding jobs. You can view all the dependent jobs on the Dependencies tab.
-
Act. Start Time – The time the job became active. Until the job is active, this field is empty.
-
Est. Duration – The estimated time it will take for the job to run. If the job has never run before, it contains the value in the Estimated Duration field in the job’s definition. Otherwise, it contains a historical average of the Actual Duration.
-
Act. Duration – The actual time the job took to run.
-
Job Owner – The user that owns the job.
-
Scheduled By – Indicates how the job entered the production schedule.
Three possible values may be displayed here:
Calendar – Compiled into the schedule based on an assigned calendar.
Event – Inserted by a job action based on an event trigger.
On Demand – Inserted by an operator via the TA client, command-line, API or Web Service.
-
Exit Code – The exit code of the completed job (if the job has not completed, this field is blank). This field is not displayed for a job group.
Exit code values mean:
if the value equals 0, the job has completed normally
if the value does not equal 0, the job has completed abnormally
-
External ID –The ID number assigned to the job process by the operating system. Certain job types have an External ID assigned by third party software, such as SAP or PeopleSoft.
-
Track Critical Path For Job – This indicates whether the job is critical or not.
-
Reruns – The number of times the job has rerun for the day.
-
Disable Carryover –This option prevents the job from being carried forward to the next day’s schedule if the job does not run on its scheduled day. If the Try again tomorrow option in the If not ready by end of day field on the Schedule tab of a job definition is selected, it will override the Disable Carryover option and the job will run on the next day.
-
-
Click the Audit Log tab to view both user-initiated job interaction and production schedule audit trail messages for the job including job control actions, job occurrence status changes and errors.
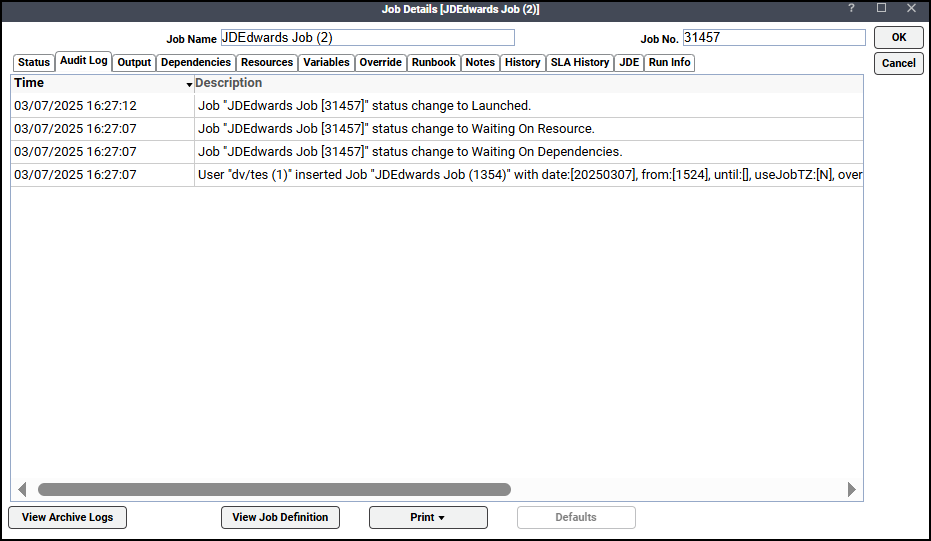
Double-click a record to display its details more clearly.
This tab contains these elements:
-
Time – The date and time the audit was recorded.
-
Description – The job audit or error message describing the change or error to the job. Audit information is retained according to the audit retention setting in the System Configuration dialog.
-
User – The user that submitted the job.
Note: Only messages that have not been archived will be displayed by default. Click View Archive Logs to display the archived log messages as well.
By default, the audit log message shows that a job waiting is on a resource. To enable granular audit logging and to audit log the particular resource or resources the job is waiting on, set the sysval 194:
-
Set the value in the sysval_string field to either Y to enable granular audit logging or N to disable granular audit logging.
-
Set the value in the sysval_integer to specify (in seconds) the threshold time limit after which logging of the exact resource name the job is waiting on happens.
-
-
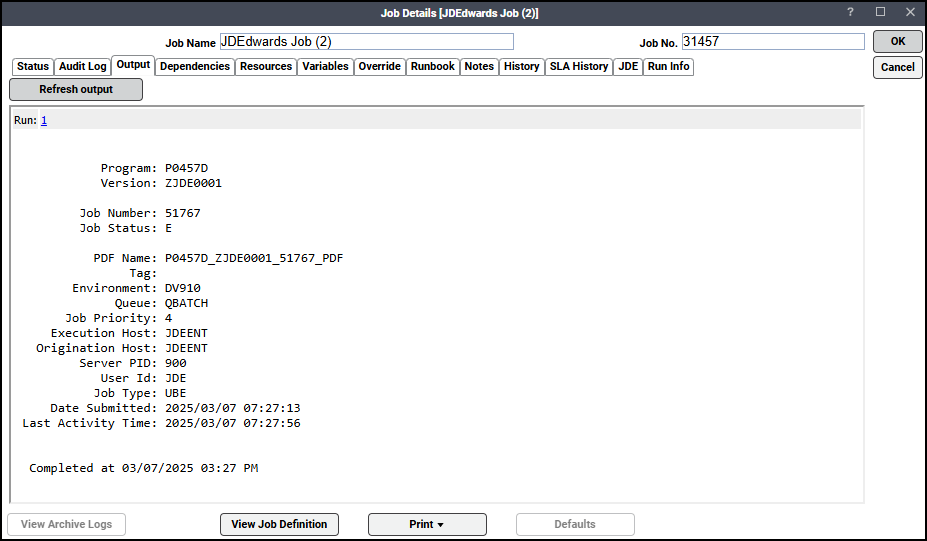
Click the Output tab to view a task summary after the job completes. If you chose to include the jde log or jde debug log for the UBE, that will be shown below in the summary.
TA can be configured to save or discard job output by default from the Defaults tab of the System Configuration dialog. Regardless of the system default, any individual job instance can be configured from its job definition to override the system default.
-
If the Append option in the Save Output field on the Options tab of the job definition is selected in the job’s definition, the job’s standard output file is transferred to the master and displayed on this tab. Each time a job is rerun that run’s output is separated by a block of number signs (#).
-
If the Replace option in the Save Output field is selected, then only the output from the last job instance that ran is saved. The output from the previous time that the job ran is overwritten.
-
If the Discard option of the Save Output field is selected than this tab will not have any job output displayed here.
If a job is canceled before it can be completed, any partial output that was generated during the processing of the job displays on the Output tab. Note that a job group does not have an Output tab in its Job Details dialog.
Note: TA’s default is to discard job output. To save or append job output or to specify that the output be produced in summary format, change the system default on the Defaults tab of the System Configuration dialog. This can be adjusted for individual jobs from the Options tab of that job’s Job Definition dialog.
You can refresh the output if parameters have been changed after runtime by clicking Refresh output.
-
-
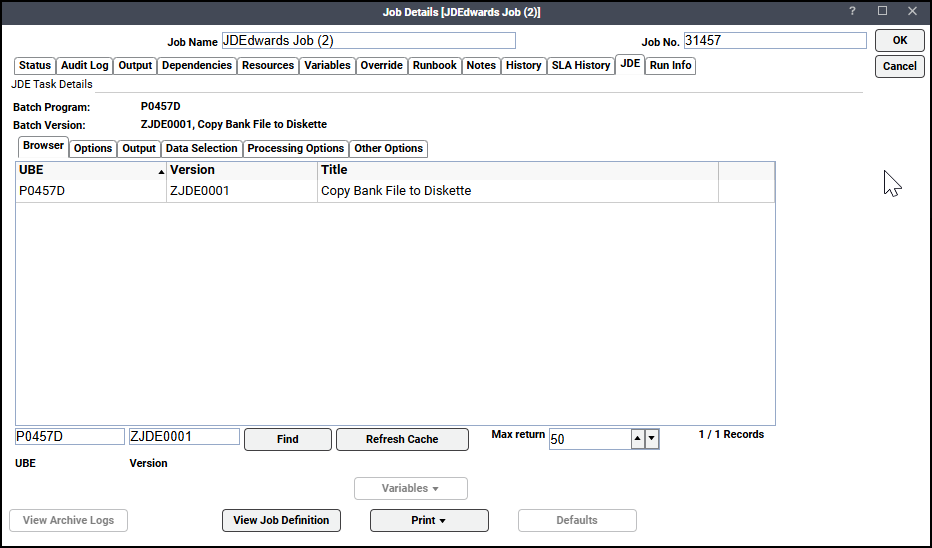
Click the JDE tab to view job definition details and the variables that are used when the job was submitted and to make any changes for a specific job before it is run.
-
Click the Run Info tab to view additional details about the job.
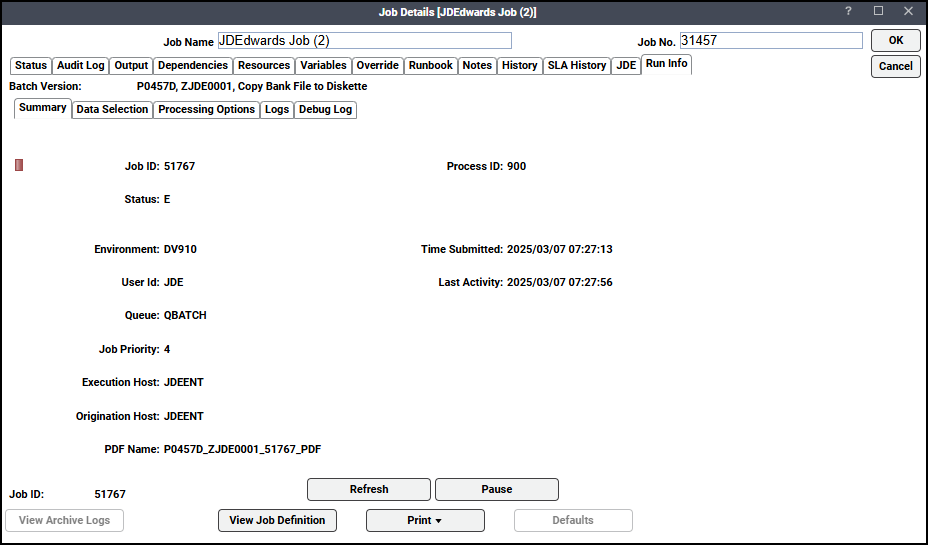
You can also view information about the runtime status while the job is running, including any runtime value overrides that are in affect.
You can also view the logs in real time if the connection is configured to access the logs.
This tab contains these elements:
-
Summary – View the run status of the last job submitted and the updates of the last activity times for the UBE during job execution.
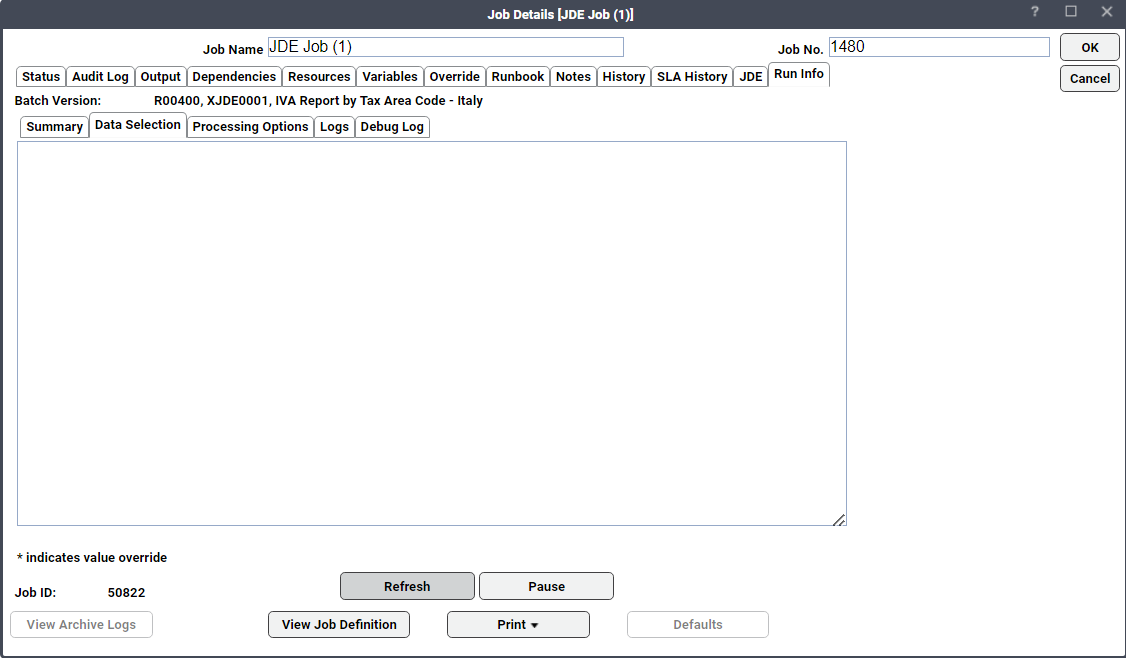
-
Data Selection – View the data selection values that were in effect during this run.
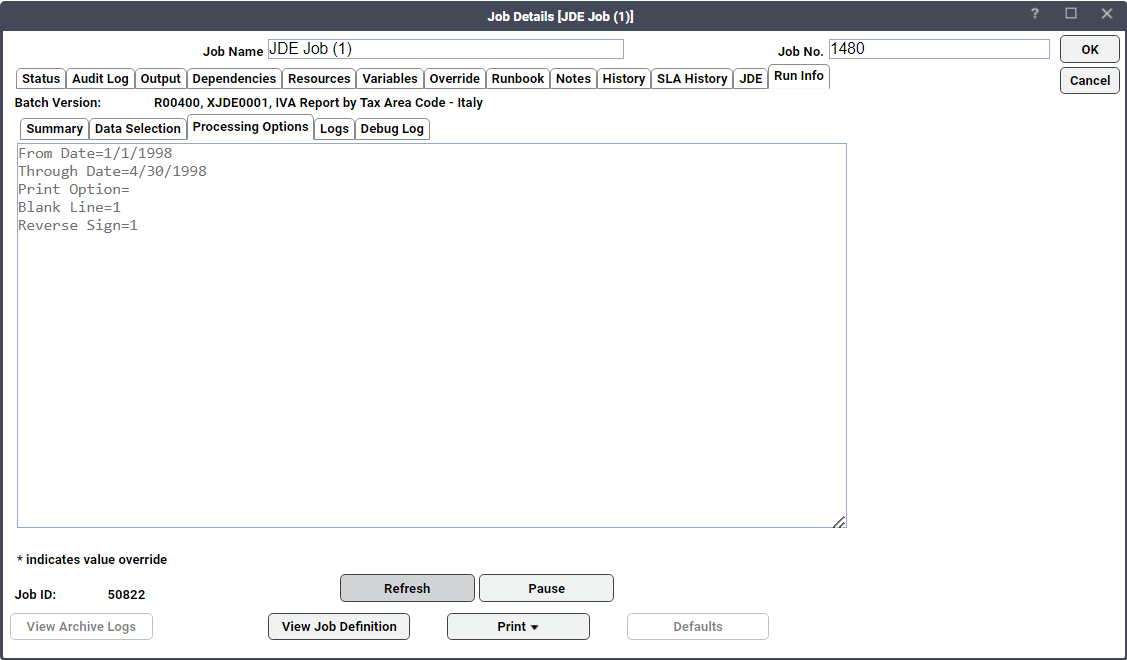
-
Processing Options – View the processing options that were in effect during this run.
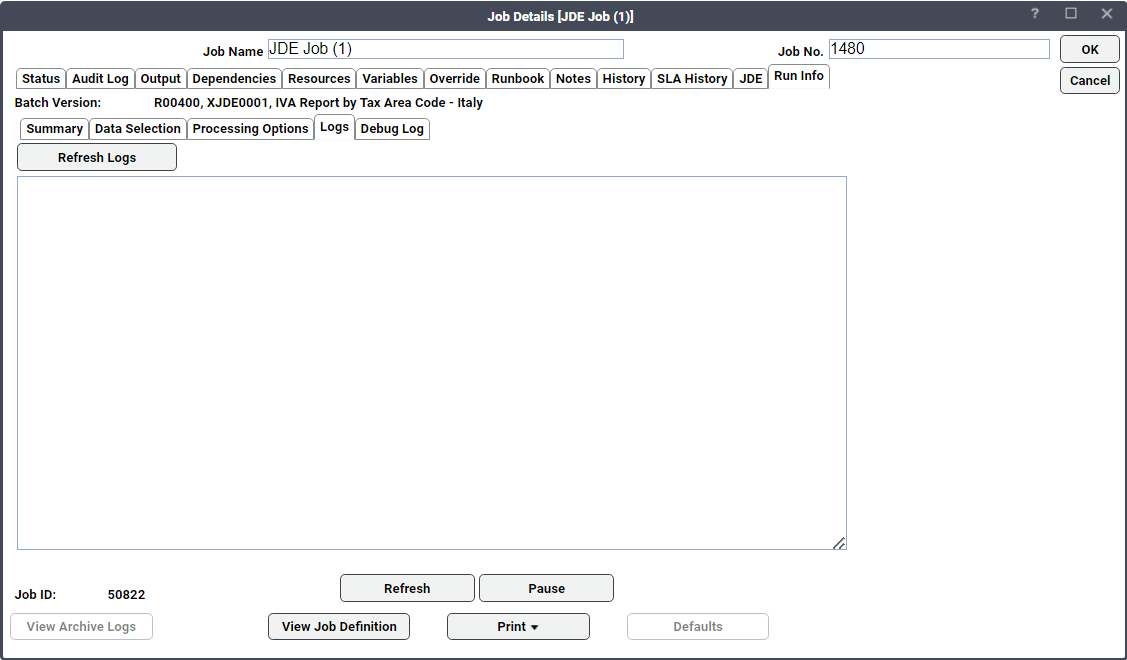
-
Logs – View the log generated during the run. If the job has not completed yet, the log may not be complete.
-
Debug Log – View the debug log associated with the job, if any.
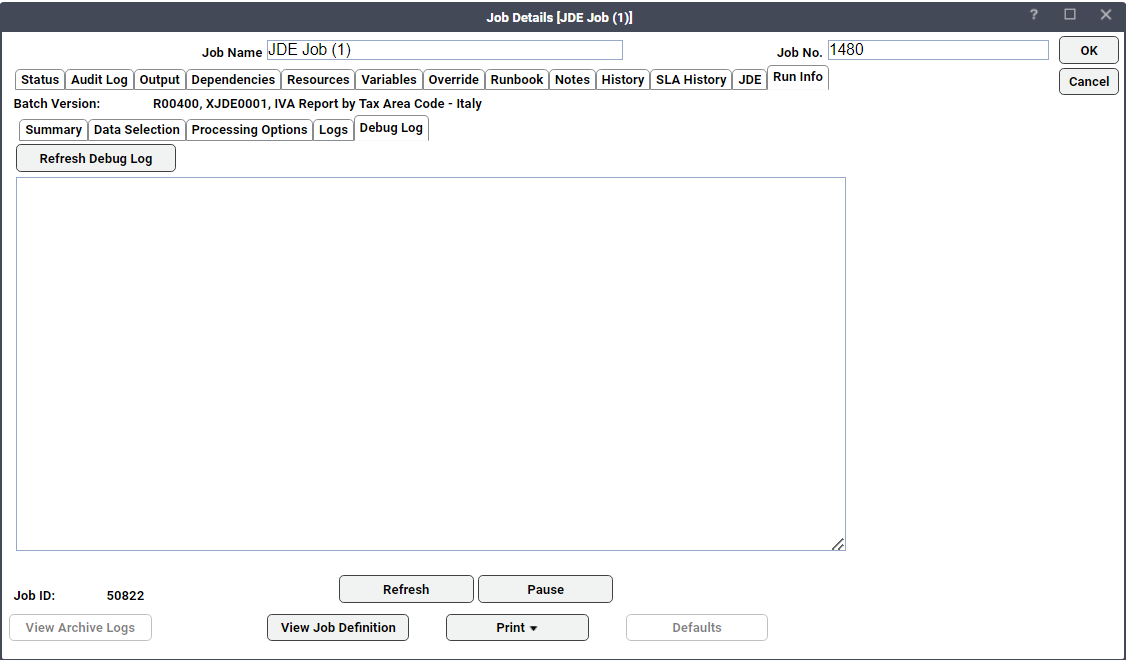
Because debug logs can be very large, only the last part of the file is shown, but this can be very useful to see what a job is doing while it is running.
-
-
Click OK when you have finished viewing the job activity details to close the dialog.
Note: You might get this error: "Failed during post-processing of job: Failed to save JDE as /home/user/JDE. Connection refused". This indicates a problem with FTP. To fix this, verify that FTP is properly configured on your JDE machine.