Adding a Databricks Spark SQL Event
To add an event:
-
Click Events > Databricks Spark SQL in the Navigation pane to display the Databricks Spark SQL Events pane.
-
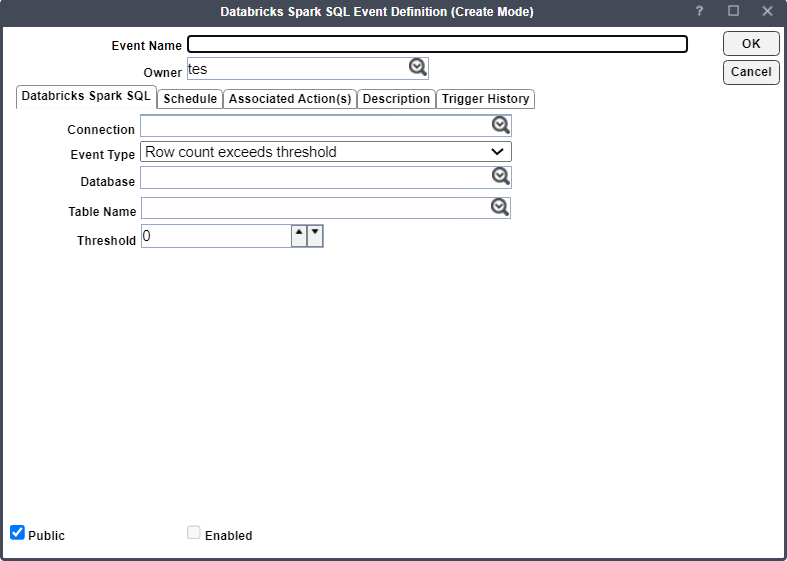
Click Add to display the Databricks Spark SQL Event Definition dialog:
-
Enter a name for the event in the Event Name field.
-
Click the owner of the event from the Owner list.
-
Specify which database connection to monitor from the list of defined connections in the Connection list on the Databricks Spark SQL tab. This tab designates the data table in the Databricks Spark SQL database. The Adapter monitors and defines the condition that initiates the event. Once the Adapter detects the set change to the data table, the event triggers any linked action(s) as an automatic response to the change.
-
Specify the database connection to monitor from the list of defined connections from the Connection field.
Note: To send the event successfully, specify the connection.
-
Designate an event trigger from the Event Type field by selecting one of these options:
-
Row count exceeds threshold.
-
Column MAX value exceeds threshold. If selected, a Column Name field displays. Choose a column from the dropdown menu.
-
Column MIN value below threshold. If selected, a Column Name field displays. Choose a column from the dropdown menu.
-
Custom query returns results. If selected, the Custom Query field displays where you can enter a query. For the first time, an event triggers when the result set of the custom query is not empty. The event triggers again only if the result set of the custom query is not empty and the result set is changed.
-
-
Specify the database you want to monitor from the Database field. For Row count exceeds threshold, Column MAX value exceeds threshold, and Column MIN value below threshold event types, the Database field is required.
Note: This field is optional for the Custom query returns results event type. If you do not specify the databases in the query, the Adapter executes SQL statements against the database specified in the Databricks Spark connection.
-
Choose a threshold for the selected event in the Threshold field:
-
For the Row count exceeds threshold event – The event triggers if it exceeds the threshold.
-
For the MIN value below threshold event – The event triggers if the smallest values in the monitored column falls below the threshold. The event is triggered again only if the column's minimum value exceeds the threshold and again drops below the threshold.
-
For the MAX value exceeds threshold event – The event triggers if the largest values in the monitored column exceeds the threshold. The event is triggered again only if the column's maximum value drops below and exceeds the threshold again.
-
-
Click Schedule to assign a schedule to the event.
-
Choose the calendar or calendar group from the Calendar Name field. This field shows the days during which the event monitor should run. To schedule the event automatically, choose a calendar for the event monitor to be scheduled automatically. Note that a calendar can encompass one or more days. If you do not choose a calendar, the event monitor runs daily. To clear the calendar, right-click Calendar, choose Clear, or choose Delete.
-
Enter in the Offset field the number of days before or after a selected calendar day that the Adapter will monitor the event. The Adapter adjusts each day in the calendar by the offset you specify.
Example: When the event monitor uses the Fiscal Month End calendar with an offset of 2, the Adapter inserts the event monitor into the schedule two days after the Fiscal Month End date –similarly, specifying an offset of -2 results in two days inserted before the Fiscal Month End date.
-
Choose from the From field the earliest date the event monitor should be active.
The event monitor operates from the first date in the calendar that is on or after this date. You can choose a date using the built-in calendar dialog by clicking the adjacent dropdown arrow.
In the To field, choose the last date that the event monitor can operate based on the calendar. If this date is not specified and your calendar includes repetitive dates, your event monitor will run indefinitely. You can choose a date using the built-in calendar dialog by clicking the adjacent dropdown arrow.
-
Click Forecast to display the Calendar Forecast dialog for the selected calendar (adjusted by offset, if provided), showing all the dates for which the event monitor will be active.
-
Click Trigger Constraints.
The Trigger Constraints section defines restrictions on actions associated with the event monitor. The constraints allow you to control the execution of actions. Sometimes, the searched event condition may trigger in rapid succession. Instead of acting on every event, you may want to limit the action execution frequency.
Note: Suppose the event is set not to trigger each Time it detects event conditions. The event monitor will continue to perform the associated action when it detects the specified condition.
-
Specify in the Trigger maximum field the maximum number of times the event monitor will react to the defined conditions within a specific time window.
-
Designate in the Occurrences in minute (s) field the time window within which the event monitor will react to the defined conditions.
-
Choose Ignore occurrences that exceed the limit option if you want to ignore any occurrences that exceed configured value.
-
Choose Time Window.
When selected, the event monitor is active only during the time values displayed. When this option is not set, the event monitor remains permanently active. This section displays multiple time windows the event monitor watches for defined conditions.
This option limits the event monitor to be active only during the defined time windows. If this option is not set, the event monitor is permanently active. This section lists multiple time windows that the event monitor will watch for the defined conditions. You can create any number of time windows using the Time Window dialog:
-
Row – A sequence number for the defined time window.
-
From Time (hh:mm:ss) – Designates the time the event monitor begins actively monitoring for defined condi- tions. This value appears in a 24-hour clock format of hours, minutes, and seconds.
-
Until Time (hh:mm:ss) – Designates the Time the event monitor stops actively monitoring for defined condi- tions. This value appears in a 24-hour clock format of hours, minutes, and seconds.
-
-
Click OK to add the new event.
Note: Once the event triggers, the event output forms, you can use the output of the Databricks Spark SQL event in any action by choosing the <EventOutput> variable. For example, for the Row count exceeds the threshold event type, you see "Row count exceeded <THRESHOLD> (Row Count for table <TABLE> is <ROWS_COUNT>) in database
<DATABASE> on <TIMESTAMP>".