Monitoring Databricks Spark SQL Activity
Use the Job Details dialog to monitor Spark SQL jobs.
To monitor job activity:
-
Click Operations > Job Activity in the Navigation pane to display the Job Activity pane.
-
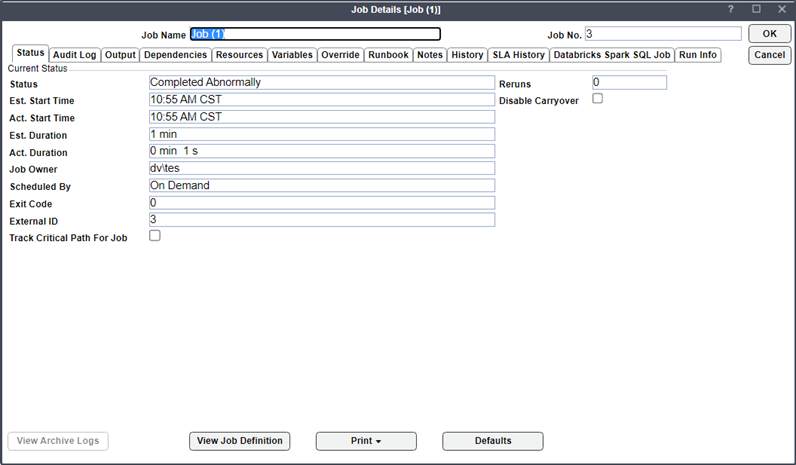
Right-click to choose a job and choose Details from the menu. The Job Details dialog displays. On the Status page, you can view the current status of the job; start, and end times; the job's run-time duration; and how the job was scheduled. The last executed step status is the final Job execution status:
-
Click Output to view the job output.
-
Choose the Databricks Spark SQL Job tab to view the original request, and the variables used when this job was submitted:
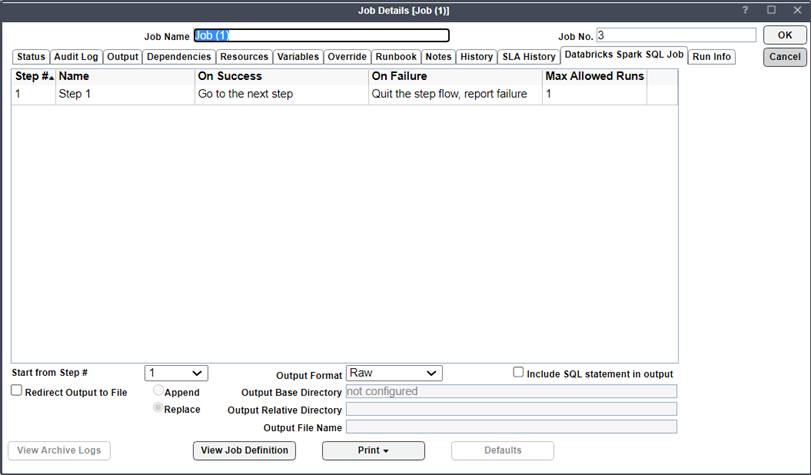
The Databricks Spark SQL Job tab is a copy of the Databricks Spark SQL tab in the Job Definition screen, where a user can specify new configuration data and then rerun a job.
Note: You cannot edit the Step table.
From the dropdown list, choose Start from Step # to change the job run definition and rerun a specific job run. Fields are disabled while the job runs, so overrides are not permitted when the job is running.
Note: Changes here apply only to this job instance (the original job definition is not affected).
-
Click Run Info tab to view the Databricks Spark SQL job-related information. This tab displays the steps in the sequence of execution. This is a read-only copy of the Databricks Spark SQL Job tab of the Job Details screen, and it contains resolved variables in the SQL tab in the Job Steps screen.
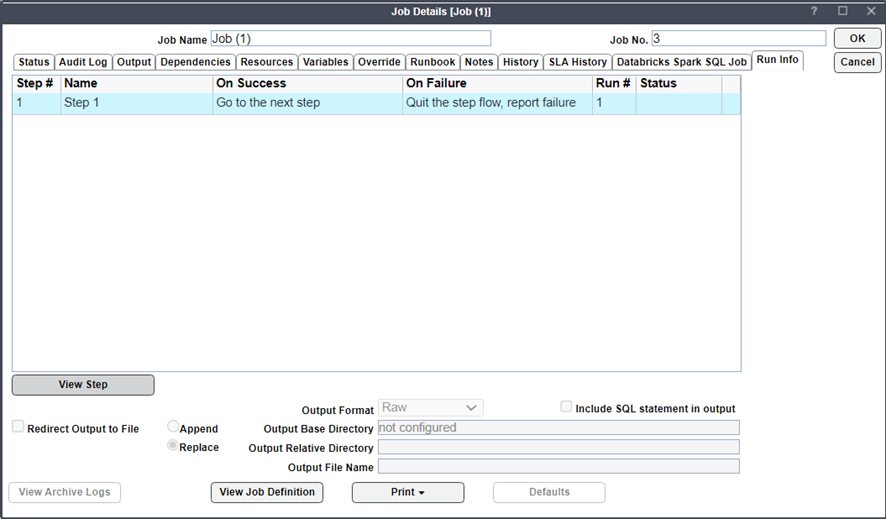
Fields include:
-
Step# – The step number.
-
Name – The name of the step.
-
On Success – The action to occur if the step is completed successfully.
-
On Failure – The action to occur if the step fails.
-
Run# – The number of times that a job has run already.
-
Status – The success or failure status of the job.
-
View Step – This button displays the Databricks Spark SQL Job Step dialog.
-