Monitoring TA
Monitoring with JConsole
JConsole is a diagnostic tool that comes with the standard JDK. It allows you to connect directly to a running JVM and monitor many performance metrics, including memory/CPU usage. JConsole can also be used to access diagnostic modules exposed by each individual application called MBeans. The Master and Client Manager expose MBeans.
Connecting JConsole
Before connecting JConsole to either the Client Manager or Master, make sure this property is set in clientmgr.props or master.props.
JmxOn=Y
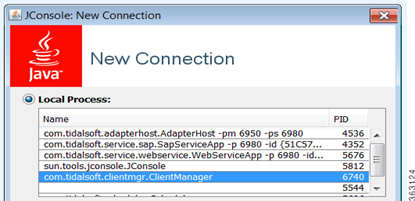
If you are running JConsole on the same machine as the JVM you are connecting to, the JVM will be listed in JConsole.
If you are connecting JConsole to a JVM running on a remote machine, type in the remote JVM's machine host name and port (the default Client Manager port is 1100).
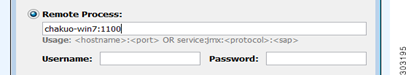
Note: You can change the default port for the JVM by setting this property in clientmgr.props or master.props. JmxRmiPort=1200.
Note: To avoid random port generation, add JmxRemotePort=1098 along with existing JmxRmiPort in master.props or clientmgr.props. For JConsole, ensure that you use the JmxRmiPort.
Viewing a System Overview
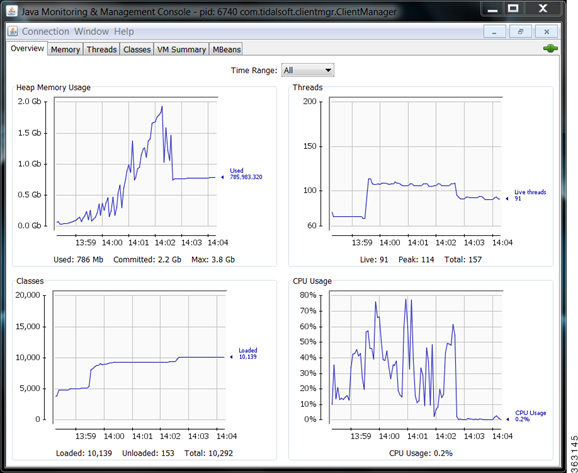
The Overview tab of JConsole provides an overview of JVM's memory, threads, and CPU usage.
To view a system overview of the vital stats for the JVM, select the Overview tab of the console.
Viewing Memory Usage
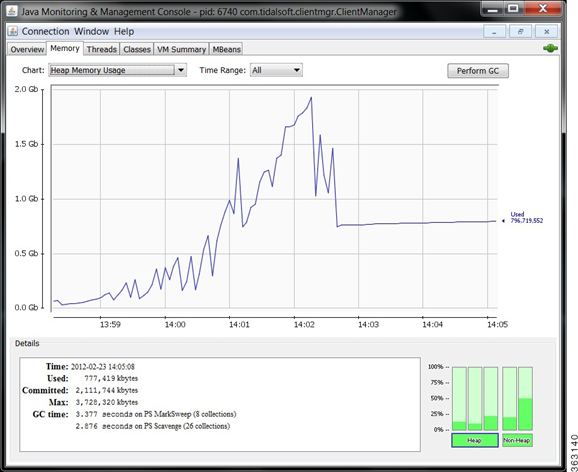
To view memory usage, click the Memory tab of the console.
The memory tab provides more detailed information about JVM's memory use, allowing you to determine if the JVM has sufficient memory for the application that is running.
Note: For a normal running JVM, you should see memory use increase and decrease in the short term. However, if you see that memory use is increasing in the long term, it may indicate a memory that will eventually result in an out-of-memory termination.
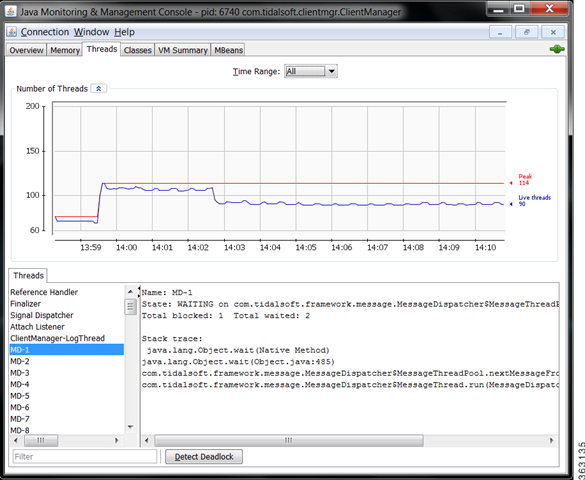
Viewing Active Threads
To view active threads and potential deadlocks, click the Threads tab of the console.
The screen provides stack traces for every thread in the JVM. A stack trace shows exactly what a thread is doing at the time of the trace. This screen allows you to automatically detect thread deadlocks.
Viewing a VM Summary
For viewing a virtual machine summary and for basic technical support information, click the VM Summary tab of the console.
Viewing the Client Manager Output Log
To view the Client Manager output, open the clientmgr.out log file located in the Log folder.