Comparing Jobs
The Compare Jobs tool lets you quickly detect differences between job definitions, structures and dependency chains.
It lets you answer questions like
-
What’s different between ’Job X’ in Production and Pre-Production?
-
What’s changed in ‘Job X’ since migrating from 6.X to 6.Y?
-
What’s different between ‘Job X’ and ‘Copy of Job X’ in Development?
The Job Compare tool is accessed using the Compare Jobs menu action.
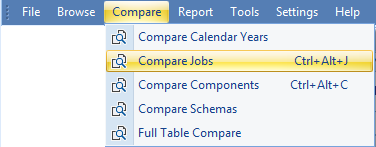
The Job Compare control has two tabs: Compare Jobs (the default) and Compare Results.
The Compare Jobs Tab
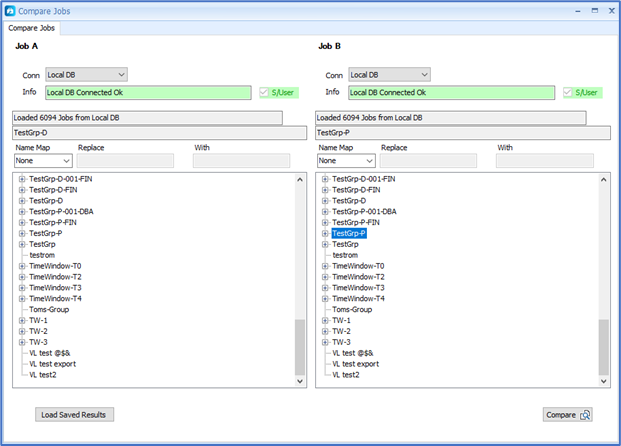
The Compare Jobs tab displays two Job Browser views, side-by-side, designated Job A and Job B. Each job browser supports selection of a Job A and Job B for comparison. You can connect to the same or different DBs in the job browsers.
Choosing a DB connection in either browser populates the tree view in that browser.
Note: The selected DBs must belong to the same Tidal Instance. Alternatively, they may belong to the same Tidal environment if the ‘AllowCompareWithinTidalEnvironment’ license is enabled. Comparison of jobs across Tidal environments is not supported.
Selecting a job in the Job A Browser Tree sets Job A for comparison. The selected job is displayed above the tree. Similarly, selecting a job in the Job B Browser Tree sets Job B for comparison. Once Job A and Job B have been selected, click Compare to run the compare operation and open the Job Comparison summary view.
Note: The selected job can be any job in the tree including groups and normal jobs.
Note: The selected jobs do not need to have the same job name.
Note: The selected jobs can be from DBs running with different versions of Tidal.
Frequently, Tidal jobs are created by copying an existing working job, renaming the new copied job, then making changes within the structure of the new job. The Compare Jobs tool lets you see what is different between the original and the copy.
Compare Jobs using Job Name mapping
Job Comparison relies on matching jobs based on the job name relative to the top-level jobs A and B being compared. Tidal users often modify job names between Tidal instances to support identification of the Instance from the job name. For example, a basic naming scheme could be that all development instance jobs will use suffix ‘-D’ and all production instance jobs use suffix ‘-P’
Compare Jobs supports comparison of job trees that adhere to consistent job-naming schemes using the Job Name Mapping UI sections above the Tree views
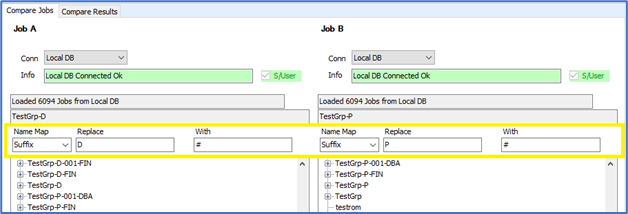
When using name mapping the objective is to select and apply a name mapping that will transform the job names in each of the compared Jobs; A and B into consistent, comparable names. The table below shows an example comparing job A that uses a D suffix with job B that uses a P suffix. The suffices are converted to # to support name-based matching.
|
Job A |
Job A Mapped Names |
A & B Mapped Names |
Job B Mapped Names |
Job B |
|---|---|---|---|---|
|
jobA-D |
jobA-# |
Yes |
jobA-# |
jobA-P |
|
jobA-D\Child1-D |
jobA-#\Child1-# |
Yes |
jobA-P\Child1-# |
jobA-P\Child1-P |
|
jobA-D\Child2-D |
jobA-#\Child2-# |
Yes |
jobA-P\Child2-# |
jobA-P\Child2-P |
These job name mapping approaches are available:
|
Controls |
Description |
||||||||||||||
|---|---|---|---|---|---|---|---|---|---|---|---|---|---|---|---|
|
NameMap
|
Type of Name Mapping to be used:
Note: When WildCard matching is selected, the input fields labels change to Expression and Mask Char. |
||||||||||||||
|
Replace + With |
Text to be replaced in the job name when using Suffix, Prefix, FirstMatch and LastMatch map types. The Replace value cannot be empty. The With field to be substituted into the job name. Backslash ‘\’ char is not allowed in the Replace or With entry fields. Examples:
Best practice is for the Replacement and With text entries to use the same number of characters. |
||||||||||||||
|
Expression + Mask
|
A wildcard expression and mask character to be used when Wildcard Matching is selected. Wildcard matching can support more complex naming schemes. Expression identifies text segments in matching job names to be masked. Wildcard characters supported:
Wildcard chars can be escaped by prefixing with backslash ‘\’ Examples:
The WildCard Expression must contain at least one wildcard character and one non-wildcard character. The Mask value cannot be empty. Only the first character entered in the Mask value is used in the mask processing. Backslash is disallowed as a mask character. |
When defining Name Mappings the UI may indicate validation errors related to the rules being defined. All validation errors must be resolved to enable Compare.
Using Load Saved Results, you also have the option to Load a Compare Jobs results set that was previously saved to a file.
The Compare Jobs Result Tab
The Compare Result tab view presents a summary of the comparison results for various data areas.
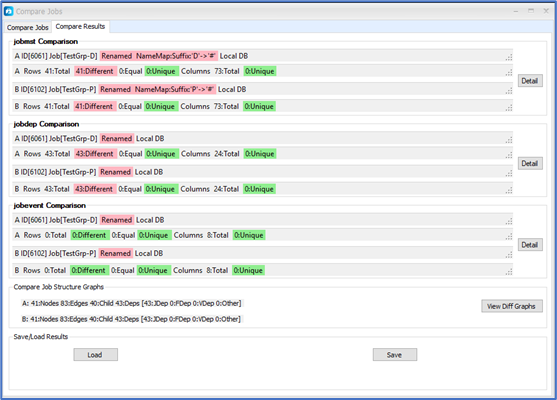
The view has five main sections top to bottom; three Data Comparison Summary areas, one Job Structure Graph Summary area and a Save/Load result area.
Data Summary Areas
The data summary areas are:
-
JobMst Comparison
The jobmst area summarizes the comparison results of the combined jobmst, jobdtl and tag information for each job. Each row compared represents a separate job in the selected job.
For jobmst comparison, jobs are matched between A and B using job names and parent paths to the jobs from the top level A and B jobs selected. When jobs A and B have different names, the comparison treats each top-level job A and B as having the same name ‘RootJobName’ to support name matching throughout the job tree hierarchy.
Any name mapping rule applied is also displayed.
-
JobDep Comparison
The jobdep area summarizes the comparison results of dependencies from the jobdeps table related to the selected jobs. Each row compared represents a separate dependency in the jobdeps table.
For jobdep comparison, the key is composed of the job path and the depended-on job, file, variable, etc.
-
JobEvent Comparison
The jobevent area summarizes the comparison results of the job events associated with the selected jobs.
Each Data Comparison Summary section contains a summary of comparison results relating to Jobs A and B, respectively.
For Job A and B:
-
Total no of rows compared.
-
Number of rows with differences.
-
Number of unique rows.
-
Total no of columns compared.
-
Number of unique columns found.
Click Detail in each Data Summary area to drill through to the detailed differences for the area.
Compare Job Structure Graphs Area
The Compare Job Structure Graph sections contain summary information for each compared job including:
-
Nodes – Total Number of Nodes in the Job Graph.
-
Edge – Total Number of Edges of any type in the Job Graph.
-
Child – Total Number of Parent to Child relationship Edges in the Job Graph.
-
Deps – Total Number of Dependencies relationship Edges in the Job Graph.
JDep – Number of Job Dependencies in the Job Graph.
FDep – Number of File Dependencies in the Job Graph.
VDep – Number of Variable Dependencies in the Job Graph.
Other – Number of Other types of Dependencies in the Job Graph.
The View Diff Graphs button produces two graph views that contain color-highlighted differences in the Job structures and dependency chains. Graphical highlighting of the differences provides context and aids comprehension of actual job structural differences. The colors used to highlight structural differences can be changed using the Job Graph Legend.
Save and Load Compare Results
Click Save to save the results of a job comparison to a [.EXJC] file, These can be reloaded from the file at a later time using Load or Load Saved Results on the Compare Jobs tab.
Viewing Details of the Comparison Results
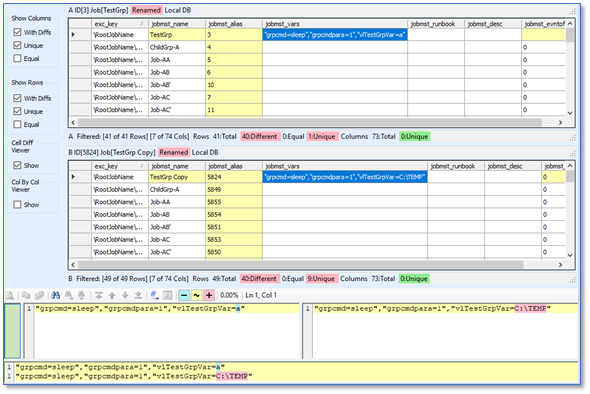
Click Detail in any of the summary areas to open a Detail Comparison View for the respective data area. The diagram below shows an example for the jobmst data area (jobmst + jobdtl).
The Detail Comparison view has six main areas:
-
ToolBar.
At the top, click Excel to export difference results to Excel.
-
Show/Hide Data and Views.
On the left-hand side are a set of check boxes that let you control the data and views shown.
Show Columns Visibility
-
With Diffs [check box]
If checked, shows columns that contain differences in grids.
If unchecked, hides columns that contain differences in grids.
-
Unique [check box]
If checked, shows columns that are unique to each grid.
If unchecked, hides columns that are unique to each grid.
-
Equal [check box]
If checked, shows columns where all values are identical for all common rows between the grids.
If unchecked, hides columns where all values are identical for all common rows between the grids.
Show Rows Visibility
-
With Diffs [check box]
If checked, shows rows that share common keys and contain differences in grids.
If unchecked, hides rows that share common keys and contain differences in grids.
-
Unique [check box]
If checked, shows rows that have unique keys in each grid.
If unchecked, hides rows that have unique keys in each grids.
-
Equal [check box]
If checked, shows rows that share common keys and contain no differences in grids.
If unchecked, hides rows that share common keys and contain no differences in grids.
Cell Diff Viewer Visibility
-
Show [check box]
If checked, shows the Cell Difference View at the bottom on the control.
If unchecked, hides the Cell Difference View at the bottom on the control.
Col By Col Viewer Visibility
-
Show [check box]
If checked, shows the Col By Col Viewer on the right-hand side of the control.
If unchecked, hides Col By Col Viewer on the right-hand side of the control.
-
-
Top Center Grid [A].
The center top grid shows the compared data from job A.
-
Middle Center Grid [B].
The center middle grid shows the compared data for job B.
-
Cell Diff Viewer.
The lower section shows a Cell Difference viewer that displays a side-by-side comparison view of a cell selected on any grid.
-
Col By Col Viewer.
The right-hand side (not displayed initially), shows a Column-by-Column viewer that can help when navigating differences when working with large numbers of grid rows. The current Col-by-Col grid can be exported to Excel.
Note: When first opened, the detail view is configured to show only rows and columns that are unique or different.
Identifying Differences in the Grids and Viewing the Differences
The first column in each grid contains the key field used to match data in A and B.
The grid cells highlighted in yellow indicate differences found between field values that are common to A and B. The difference colors used can be configured using the Options dialog in the Settings menu.
Selecting on a yellow cell in either grid shows the differences for that field between A and B in the side- by-side comparison view at the bottom of the Control.
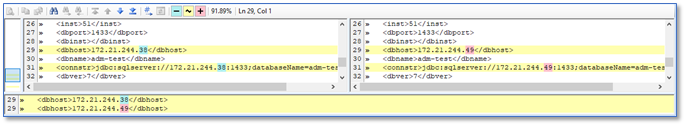
Tidal stores certain data in XML format in some columns. The Cell Difference Viewer supports comparison of XML-based data. The size of the Cell Difference viewer can be expanded as required to suit the data being compared. You can then navigate through the differences in the XML using the Cell Difference viewer navigation buttons.
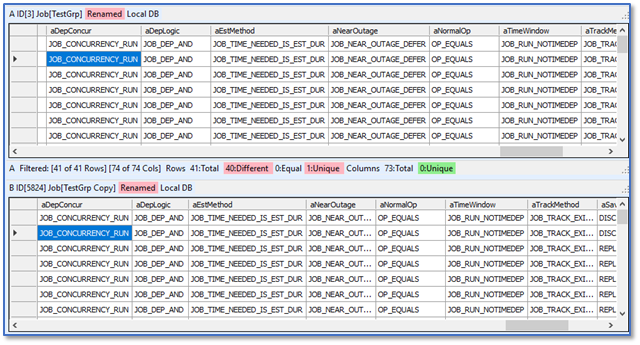
Tidal stores many values using numeric codes to identify particular states. The Compare operation augments the raw results by adding columns that show translations of certain numeric values to meaningful text that you can use for interpretation of difference results. Augmented columns are prefixed with 'a' and have a meaningful name.
Working with Large Data Sets
If you have large results grids containing thousands of rows, you may find that differences are not visible in the grids without scrolling. In this situation, you can enable the Column-by-Column viewer to simplify navigation through the differences in a given column.
When this viewer is active, clicking on a column cell in one of the main A or B grids results in a filtered view of the differences for that column. Click the cells in the filtered list to identify the differences and view the side-by-side value comparisons.
To view a filtered list of differences for a column, click a cell in another column in grid A or B.