The Job Graph Viewer Control
The Job Graph Viewer control is used to view all job graphs. The Graph viewer control contains a toolbar, a graph view area, a find panel, a properties panel and a status bar. The find, properties and status controls are not visible by default and can be displayed on user request.
Various types of information are displayed on the graph area.
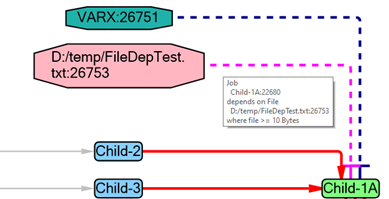
Hovering the mouse over a graph edge relationship between two nodes will display a tool tip with information about that relationship. The Explorer includes a Job Graph Legend editor which allows you to customize the look of the various job entities and relationships.
Graph Viewer Properties Panel
To view properties related to a job or relationship in the graph in the Properties panel:
-
Right-click anywhere on the graph canvas to show the context menu and click Properties to display a Properties panel on the right-hand side of the graph and Find panel.
-
Mouse over any node or relationship in the graph to see properties for that item displayed in the Property grid.
-
Click Hide at the bottom of the Properties panel to hide the panel.
The width of the Properties panel can be adjusted using the narrow bar on the left of the panel.
Graph Viewer Job Find Panel
To search for and navigate to jobs in the graph by using the Find Jobs menu:
-
Right-click anywhere on the graph canvas to show the context menu.
-
Click the Find Jobs option to display a Find Jobs panel on the right-hand side of the graph.
Using the Find panel locate jobs using the criteria:
|
Controls |
Description |
|---|---|
|
Job Name/ID |
Match any jobs with jobmst_name or jobmst_alias containing the supplied text or match the job whose jobmst_id matches the text if the text is a positive integer value. |
|
Job Info |
Match any jobs that contain the supplied text in their jobdtl_cmd or jobdtl_params or jobdtl_extinfo fields. |
|
Owner |
Match any jobs that match the selected owner. |
|
Class |
Match any jobs that match the selected jobclass. |
|
Service |
Match any job that references the selected service. |
|
Connection |
Match any job that references the selected agent/connection. |
|
JobType |
Match any jobs that match the selected jobtype. |
|
Tags |
|
|
Level |
Match any job that matches the selected job level criteria in the job tree. Root Jobs having no parent jobs are level 1, their child jobs are level 2, and so on. |
|
Inserted In Schedule by Events |
Match any job that can be inserted into a schedule by an event. |
|
Active |
Match any job based on Active status. |
|
Compound Dep |
Match any job using a compound dependency. Only visible when connected to DB for Tidal 6.5.4 or higher. |
|
Custom Start Time |
Match any job using a custom start time. Only visible when connected to DB for Tidal 6.5.4 or higher. |
-
Click Search to identify matching jobs and displays in the graph. The found jobs are listed As each found job is selected in the finding results, the graph highlights the corresponding job node in the graph and brings it into view, if required. Right-clicking in the Search results displays a context menu for the selected job.
For Compound Dependency graphs, it is possible to have multiple instances of the same job node in the graph diagram. In this case, all nodes matching the selected found job are highlighted.
-
Click Reset to clear the filter criteria. The width of the Find panel can be adjusted using the narrow bar on the left of the panel.
-
Click Hide at the bottom of the Find panel to hide the panel.
Graph Viewer Toolbar
The Graph viewer includes a toolbar with these control groups.
Graph Navigation, Zooming, Scroll Control Group
|
Controls |
Description |
|---|---|
|
Zoom To Home button |
Resets the view for the graph back to the initial view that encompasses the entire graph. |
|
Zoom In button |
Zoom in to the graph. |
|
Zoom Out button |
Zoom out from the graph. |
|
Rectangular Zoom toggle |
When toggled on, you can click and drag a rectangular section of the graph to zoom in on that area. You can also zoom in/out by holding Ctrl and using the mouse wheel. |
|
Drag Scrolling toggle |
When toggled on, you can click and drag the graph around to scroll its location. |
|
Navigate Back button |
Undo the view port of the graph to its previous state. You can apply this function multiple times. The undo/redo stack is reset if the graph layout is recalculated. |
|
Navigate Forward button |
Redo the view port of the graph to its next state, can be applied multiple times. The undo/redo stack is reset if the graph layout is recalculated. |
Graph Save, Print, Info Control Group
|
Controls |
Description |
|---|---|
|
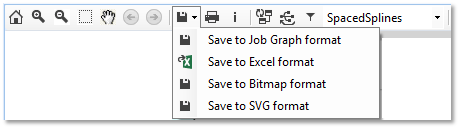
Save to Job Graph Format |
The graph can be saved to the Job Graph format [*.EXJG] for standard job graphs or [*.EXDG] for Compound Dependency Graphs. These graphs can be reloaded from file by using the Load Job Graph or Load Compound Dependency Graph menu actions respectively. |
|
Save to Excel Format |
Save the data in the graph to Excel. |
|
Save to Bitmap image format |
Save the data in the graph to one of the formats JPG, BMP, GIF or PNG. |
|
Save to SVG format |
Save the graph to SVG format for viewing on web browsers such as Google Chrome or Microsoft Edge. The SVG output also supports saving and viewing of massive graphs that can cause out-of-memory failures when saving to bitmap image formats. |
|
Print the Graph |
Displays a print dialog allowing printing of the graph. |
|
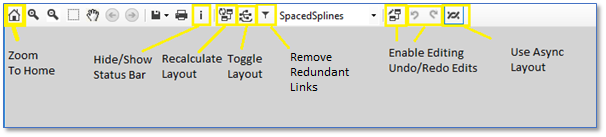
Show/Hide Info toggle |
When toggled on, a status bar is displayed at the bottom of the graph viewer. The status bar shows information about the graph and the current node or edge currently hovered over by the mouse. |
Graph Layout Control Group
|
Controls |
Description |
|---|---|
|
Recalculate Layout button |
Re-runs the automatic layout on the graph. Manual layout edits are lost, and the graph is returned to Home view. |
|
Graph Layout button |
Swaps the graph layout between Top to Bottom and Left to Right. Reruns automatic layout and graph is returned to Home view. Note: The default layout direction can be configured in the Job Graph Legend. |
|
Remove Redundant Links button |
Toggles visibility of edge labels and job parent child edges on the graph. This can help declutter a graph by hiding parent child relationships, while retaining sufficient parent relationships to maintain the basic connected structure of the graph. |
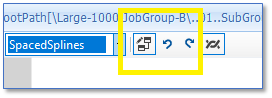
Edge Routing Strategies Menu
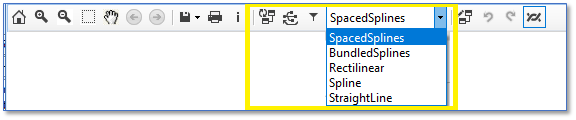
You can choose from a range of Edge Routing Strategies which provide a richer palette of graph structure visualization options.
The Edge Routing Strategies options are:
|
Controls |
Description |
|---|---|
|
SpacedSplines |
The default edge routing mode. |
|
SplineBundling
|
Edges are drawn in ordered bundles that can help declutter complex graphs and reveal related job structures and rivers of job dependencies. |
|
Rectilinear |
Rectilinear Edge routing displays the graph using a network diagram-type layout. |
|
Spline |
Edges are routed as a sequence of Bezier segments, skirting the node boundaries. |
|
StraightLine |
The simplest and fastest routing strategy. Edges drawn as straight lines between nodes. |
Note: The Rectilinear and SplineBundling routing strategies require significantly greater computer resources than the other strategies and will take longer to layout very large graphs.
Graph Editing Control Group
|
Controls |
Description |
|---|---|
|
Enable/Disable Manual layout Editing toggle |
When toggled on, manually edit the graph layout by selecting a node or a group of nodes on the graph and dragging the selected nodes to a new location. |
|
Undo Edit button |
Active when manual layout editing is enabled, this control allows you to undo a series of manual layout edits. |
|
Redo Edit button |
Active when manual editing is enabled, this control lets you redo a series of manual layout edits that have been undone. |
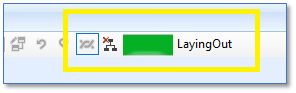
Graph Layout Mode Group
|
Controls |
Description |
|---|---|
|
Enable/Disable Asynchronous layout toggle |
When toggled on (the default), graphs are rendered asynchronously to prevent blocking the user interface. |
|
Cancel Async Layout
|
A Cancel Layout button is displayed when the control is rendering large graphs asynchronously. |
|
Progress Bar |
A small progress indicator is displayed during asynchronous layout. |