Job Run Gantt Control with Critical Path and Job Stream Trace Analysis
The Job Run Gantt Control is available via the Job Run Gantt and Trace Analysis context menu action wherever job runs are displayed in Explorer. It is also displayed after loading Gantt data from a saved file.
The Gantt control offers these advanced Gantt analysis features:
-
Critical Path Analysis to identify the critical chains of jobs with the minimum slack in a job run graph.
-
Job Stream Tracing to identify tasks that are upstream and downstream from a given job.
Gantt Data Scope Management
A Gantt Scope Management is displayed if the Settings > Options > Gantt setting is configured to allow its display. Otherwise, the Gantt analysis will use the max constraints defined in the Option > Gantt setting to constrain the job run data in the Gantt Analysis.
Gantt Data Scoping is an advanced feature that can help reduce the amount of data displayed in the Gantt charts when working with very large and complex job runs. It defines scope constraints on the job run trees and dependencies to be displayed on the Gantt control.
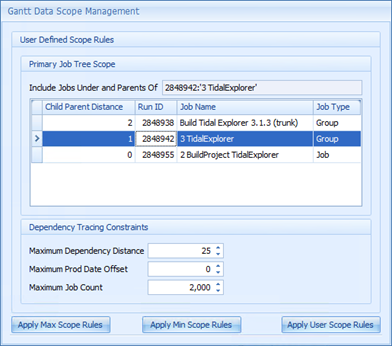
The Gantt Scope Management view has a two main sections; a top section that captures user defined scope rules and a bottom section containing scope action buttons.
User Defined Scope Rules
The User Defined Scope Rules panel has two sections that together describe a user defined scoping definition.
Primary Job Tree Scope configures the scope of the target job and parents parent tree to be included in the Gantt view.
Include Jobs Under and Parents Of
The Gantt will contain the target job and all its child jobs if it is a group, as well as all parent jobs of the target job.
Dependencies between jobs in the Primary Job Tree Scope are also included.
Use the Target Parent Job Selection Grid to select the target job and is parent jobs.
Selecting a job row in the grid sets that job as the target job.
The 0th job is always the target job selected for the Gantt processing.
The 1st job is the immediate parent of the Target Job and so on.
Dependency Tracing Constraints configures how predecessor jobs outside the Primary Job Tree Scope will be included in the Gantt. Predecessor jobs and their parent jobs can be introduced when they are depended on by jobs in the Primary Tree Scope or by other predecessors.
Maximum Dependency Distance
Constrains the number of dependency trace levels between the Primary target job and predecessor jobs.
0 disallows tracing to predecessor jobs outside the Primary Job Tree Scope
-
1 trace one level of predecessor job to the target job
-
2 trace two levels of predecessor jobs to the target job and so on
Maximum Prod Date Offset
Constrains predecessor jobs traced from the target job to those where the predecessor jobs production date matches these criteria:
Predecessor Prod Date <= Target Prod Date
AND
Predecessor Prod Date >= Target Prod Date - Offset
0 disallows tracing to predecessor jobs with production date earlier than the target jobs production date.
Maximum Job Count
Constrains the maximum number of jobs allowed in the Gantt view.
Scope Action Buttons
The bottom panel has three buttons to apply a desired scope rule and close the scope view.
Apply Max Scope Rules
Apply the maximum-allowed scope constraints defined in the Settings > Options-Gantt view to the Gantt Generation. Equivalent to showing the Target Job, its parents and its subtree if it is a group and tracing Dependencies to the Maximum allowed extent. See Maximum Scope figure below.
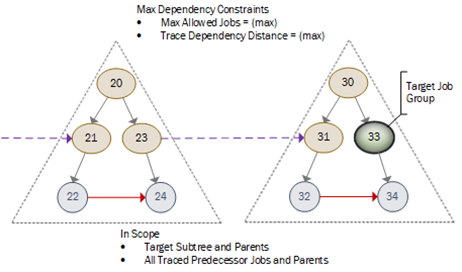
Performance Warning: Use maximum scope with care if your schedule has very large job trees and inter job tree dependencies.
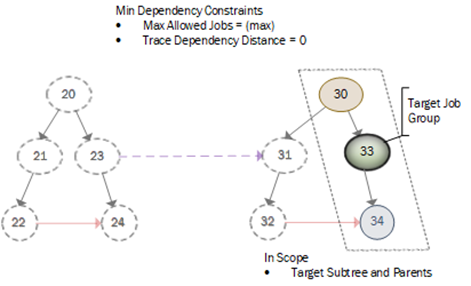
Apply Min Scope Rules
Apply the minimum scope constraints to the Gantt Generation. Equivalent to showing the Target Job, its parents and its subtree if it is a group and disallowing Tracing of dependencies outside the Primary tree scope. See Minimum Scope figure below.
Apply Uses Scope Rules
Apply the settings defined in the User-Defined Scope Rules section. See the Custom Scope figure below.
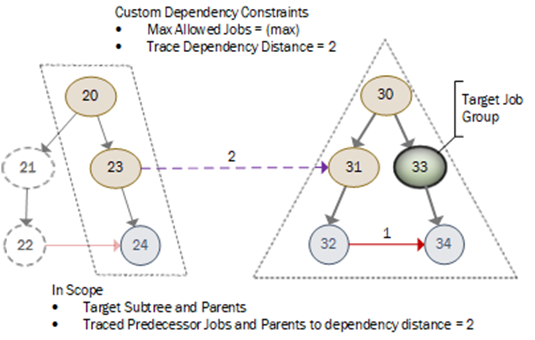
The Gantt view is generated for the target job run (the operation root) and includes all parents, siblings, predecessor job runs. and dependencies associated with the job run within the scope constraints defined.
Gantt View and Behavior
The displayed Gantt Control has seven main view tabs:
-
A Gantt view comprising a Tree view on the left-hand side and Gantt Chart on the right-hand side.
-
A Display Options view that configures Gantt View display options and advanced filtering options.
-
A Job Run information view that displays information about the currently focused job run in the Gantt view.
-
A Critical Path Analysis (CPA) view that displays information about the last CPA operation performed.
-
An Audit Log view that displays the Audit messages for the selected job run in the Gantt view.
-
A Job Run Properties view that displays low-level (Database field level) information about the currently focused job run in the Gantt control.
-
A Gantt Analysis Settings view that supports user configuration of the analysis settings.
Drag and drop the tabs into different layout configurations within the parent Gantt window.
When in the Gantt View, click Ctrl + P to print the Gantt View, comprised of the Tree view and Chart.
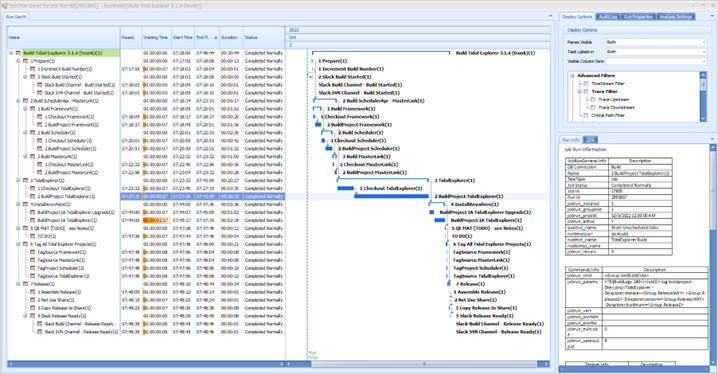
Non-job dependencies are displayed as milestones in the Gantt view that precede the dependent job start time.
Ready milestones may also be added. These milestones precede any job where the time spent ‘waiting for resources’ from the time the job is ‘ready’ until the job starts exceeds a watermark duration. This can be useful to identify jobs that wait for longer time periods. You can modify and save the job WaitingTime duration watermark in the Analysis Settings view. The default value is two minutes. The saved Analysis Settings are used in subsequent runs of the Gantt View. Gantt data loaded from a saved File uses the settings in use at the time the Gantt data was originally created.
Long wait notices are also included the summary statistics displayed for the Gantt view in the Run Info view.
Note: A job may be waiting due to a resource not being available. Currently, Gantt analysis does not access the resource lock/unlock events that would support deeper analysis of the causes of wait times. This may be included in a future release.
The name associated with the operation root job appears in green on the Tree view and is set as the initial focused task.
Time Windows associated with the Operation Root job
The Gantt chart may display these Time Window indicators if:
-
Those indicators apply to the operation root job.
-
The Gantt Chart timeframe permits as shown below.
|
Time Window |
Description |
|---|---|
|
Job Run Window |
The start-time and end-time associated with any Run Window are displayed using green and orange dashed lines, respectively. |
|
SLA Risk Window |
The SLA Risk window. |
|
SLA Breach Window |
The SLA Breach window. |
The Gantt chart displays these information:
-
Milestones and jobs, collectively referred to as tasks. Milestones are used to illustrate File and Variable dependencies.
-
Dependency relationships from predecessor tasks to successors tasks.
Gantt View Tree View Area
The Gantt Tree View displays the jobs and milestones for the Gantt view.
It supports sorting, filtering, and finding tasks by column as well as column display customization via a column selector.
The current focused task row is indicated on the Tree view and the Gantt chart.
When a new task is focused in the Gantt view, the Run Information view and Run Properties views are updated to display data for that focused task.
A context menu that operates on the focused task is available to support these Gantt-specific operations.
|
Gantt Context Menu Items |
Description |
|---|---|
|
Expand → All Nodes |
Expands all tasks in the Gantt Tree view. |
|
Expand → Node Subtree |
Expands all tasks in the subtree associated with the current focused task. |
|
Collapse → All Nodes |
Collapses all tasks in the Gantt Tree view. |
|
Collapse → All Except Node |
Collapses all tasks in the Tree view except the current focused node, then fully expands the focused nodes subtree. |
|
CPA |
Run a Critical Path Analysis based on the current focussed job task. The CPA analysis results can be viewed in the Gantt chart and in the CPA view. |
|
Search Run Output for All Jobs in Gantt |
Open a Run Output Search dialog to search run outputs for all normal jobs in the Gantt view for matching text |
|
Paste Image
|
Displays an image capture dialog that can be dragged and resized over an area of the screen. Clicking Capture grabs the image under the current area and appends the image into the Job Run Information control. The Cancel button stops the operation. |
|
Save Gantt to File |
Saves the Gantt data to a file in the Gantt Format [*.EXGN]. When the mouse is positioned in the Tree or Gantt views, press Ctrl + S to save the Gantt file. Saved Gantt files can be loaded and viewed later using the MainMenu > File > Open Gantt File option. |
The Gantt Tree view displays these columns:
|
Gantt TreeList Column |
Description |
|---|---|
|
Name
|
Name of the Job, with expandable/collapsible nodes. A jobrun that has a time window also displays a calendar and timer icon next to the job name. Name of the Job that represents the root Job Run operation for the Gantt generation is highlighted in green in the Tree view. |
|
Ready |
The time the job became ready to run in format HH:mm:ss. Ready time is when a jobs required dependencies became met allowing the job to get ready to run. At this time a normal job will enqueue and wait for resources to become available. |
|
WaitTime |
The time a job spent in a waiting state prior to the job becoming active in dd:HH:mm:ss format. For normal jobs, this is equivalent to the time spent ”Waiting for resources”. The WaitTime displays a color-formatted bar to visually reflect the relative wait times between all jobs in the Gantt View. Jobs with the longest WaitTime have a color bar that spans the full width of the column. |
|
StartTime |
Actual start time for the job in format HH:mm:ss. If a job has not actually started, then the Gantt uses Estimated StartTime and EndTime to display the unstarted jobs. |
|
EndTime |
Actual end time for the job in HH:mm:ss format. |
|
Duration |
Actual time duration of the job in HH:mm:ss format. |
|
Status |
Status of the Job Run. The Status column uses a color format to show job failure states. |
|
Est Start Time |
Estimated start time for the job. |
|
Est End Time |
Estimated end time for the job. |
|
Est Duration |
Estimated end time for the job. |
The Gantt Context menu displays these items:
|
Gantt Context Menu Items |
Description |
|---|---|
|
Est Dur Q |
A value between (0-100%) that indicates the quality of the duration estimate, where zero indicates a perfect estimate and 100% is a worse estimate. Est Duration Q = Absolute symmetric error = Abs((Actual – Estimate) / (Actual + Estimate)) You can choose to ignore Abs(Actual – Estimated) duration differences below a time value threshold. For example, you could ignore differences less than 10 seconds. You can configure the threshold in the Analysis Settings view. The default value is five seconds. The EstDuration Q metric is displayed via a color-formatted bar on the EstDuration column to visually illustrate the duration estimate quality. |
|
Re-runs |
Number of re-runs associated with the job. |
|
Run ID |
Run ID for the job run. |
|
TaskType |
Indicates the type of task displayed:
|
|
Progress |
Indicates the progress of a job (0 for not started or active, 100% for done). |
|
Traced |
The Traced column is displayed when job Tracing has been activated and indicates:
Tasks that are downstream Down from the trace root. |
|
SLA Time Compliance |
Indicates the SLA Time Compliance of job runs that have completed:
The SLA Time Compliance considers the end time associated with the job run in relation to SLA time constraints. It does not consider completion status of the job run. |
|
Latest SLA Event |
The latest SLA event raised for the job run. |
|
Agent |
Name of Agent. |
|
AgentType |
Agent or Agent List. |
|
AdHoc |
Y if the job was inserted manually into the Schedule. |
These Tree view columns are visible by default:
-
Name
-
WaitingTime
-
StartTime
-
EndTime
-
Duration
-
Status
These Tree view columns can be hidden/displayed via the column selector:
-
Agent
-
WaitingTime
-
StartTime
-
EndTime
-
Duration
-
Status
-
EstStartTime
-
EstEndTime
-
EstDuration
-
AgentType
-
EstDurationQ
-
ReRuns
-
RunID
-
Progress
-
TaskType
-
SlaTimeCompliance
-
LastSlaEvent
-
AdHoc
Gantt View Chart Area
In the Gantt Chart you can:
-
Change the focused task by clicking a task row.
-
Access the context menu for the focused task.
-
Zoom in the X-Axis (Time) using Ctrl + Scroll Mouse Wheel Up.
-
Zoom out the X-Axis (Time) via Ctrl + Scroll Mouse Wheel Down.
-
Scroll up/down/left/right using the vertical and horizontal scroll bars.
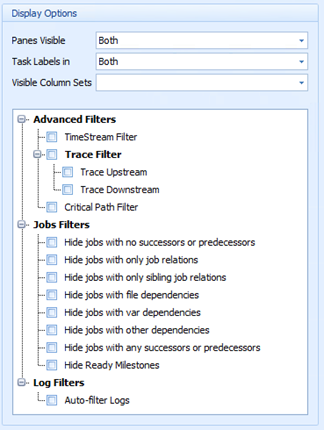
Gantt Display Options View
The Display Options view provides Gantt display customisation and advanced filtering options.
|
Display Option |
Description |
|---|---|
|
Panes Visible |
Toggles visibility of the Gantt Tree and Chart panes. Drop down list with these options:
|
|
Task Labels in |
Toggles visibility of the task names in the Tree and Chart panes. Drop down list with these options:
|
|
Visible column sets |
Toggles visibility of sets of related columns in the Tree. A Multi-Select dropdown with these options:
|
|
Advanced Filters Time Stream |
Time Stream filtering displays only Tasks that ran in the timeframe shown in the visible Gantt X-axis. Time Stream filtering can be used in combination with time zoom and scrolling to illustrate the dynamic behaviour and evolution of the running tasks through time. Checkbox – Enables/Disables time stream filtering in the Gantt View |
|
Advanced Filters Trace Filter
|
Enable Trace filtering for the Gantt View to displays all jobs that are upstream and downstream of the focused job. An additional Traced column is displayed when a trace filter option is checked. TraceFilter Checkbox – Enables/Disables both upstream and downstream Trace filtering for the focused task. TraceFilter > Trace Upstream Checkbox – Enables/Disables upstream Trace filtering for the focused task. TraceFilter > Trace Downstream Checkbox – Enables/Disables downstream Trace filtering for the focused task. |
|
Advanced Filters Critical Path Filter |
Checkbox – Enable/Disable filtering for the Gantt View to only displays tasks that are associated with any Critical Path Chain that is checked in the CPA view results grid. |
|
Job Filters |
These Job Filters can be together with the Time Stream and Trace filtering to further refine the jobs displayed on the Gantt view.
Note: Time Stream, Trace, Critical Path and Job Filtering will override any existing user filters defined in the Gantt Tree and can be used together. |
|
Log Filters Auto-filter Logs |
Checkbox – Enable/Disable automatic filtering of the Audit log view based on the focussed task. |
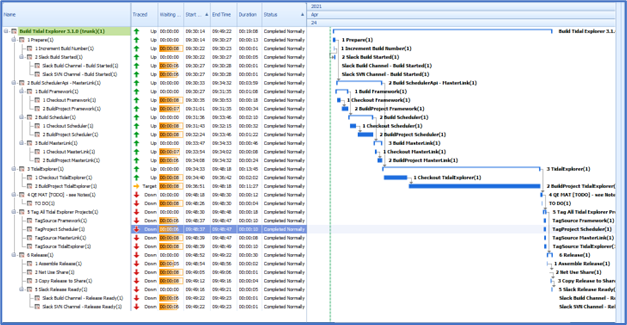
Gantt View Job Stream Trace Analysis
Job Stream Trace analysis allows for quick identification of all upstream predecessors and downstream successors for a given job.
Upstream Analysis can answer these questions for a given Job X:
-
“What upstream jobs does job X depend on that could affect X’s ability to transition into the ready state (waiting on resources)?”
-
Or “What upstream jobs could delay Job X getting ready to start?”
-
Or ‘What are my predecessors?”
Downstream Analysis can answer these questions for a given job X:
-
“What downstream jobs depend on Job X to complete before they can get ready to start?”
-
Or “What downstream jobs could Job X’s completion delay getting ready to start?”
-
Or “What are my successors?”
Trace analysis is a powerful advanced filter function. It traces through all job run dependencies and group containers to derive the full list of upstream and downstream tasks from a specified Trace Target job.
Running a Trace operation automatically filters the Gantt view to display only the traced tasks and the Trace Target task. The trace direction for each traced task is displayed in a Traced column that is visible when tracing is enabled as shown below.
Notice that user-defined grid filters are overridden when Stream Tracing is enabled.
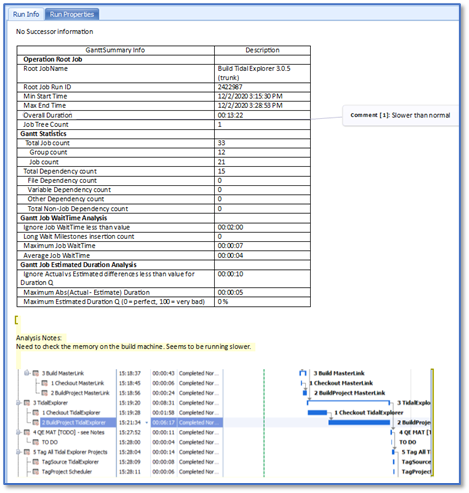
Gantt Job Run Information View
The Run Information view displays read-only information related to:
-
The currently focused task such as job run data, job commands, job event and sla timings, predecessor, and successor information.
-
Analytics and statistics for the overall Gantt data including tree, job, and dependency counts, WaitTime metrics and warnings, and Estimate Duration Quality metrics.
You can augment read-only information with your own analysis notes and save the view content to various file formats.
You can update the information content as follows:
-
Select a portion of the read-only content, right-click to add a user comment.
-
Append your own content in the user-editable section at the end of the view content.
-
Use the Paste Image ‘Capture’ context action to paste an image from a section of the Gantt view into the view content.
The diagram below shows run information content together with user comments, user analysis notes, and a captured image.
When the cursor is positioned in the Run Information view, press Ctrl + S to save the content in various formats including MS Word.
Note: If edits are made to standard content and the focused task is then changed, you are notified that you have unsaved edits. You can save or discard the edited content.
You can zoom in and out of the job run information content by:
-
Zoom in using Ctrl + Scroll Mouse Wheel Up
-
Zoom out via Ctrl + Scroll Mouse Wheel Down
Gantt Audit Log View
The Audit Log view displays the message log data associated with the job runs in the Gantt view. The audit log grid is filtered automatically when the focussed task is changed, and the Display options view Auto-filter Logs checkbox is checked.
Gantt Job Run Properties View
The Run Property view displays read-only information related to low-level database fields for the current job run. The fields are read-only, categorized by table and split into banded views. The property control includes a Find control that supports finding properties by name. To display the Find control, type Ctrl + F.
Gantt Critical Path Analysis (CPA) View
The CPA View displays results for Critical Path Analyses based on the actual (static) historic job run data loaded into the Gantt control after the job run has completed.
CPA is valuable as it can help identify the sequence of jobs and relationships in a complex schedule that form a chain with the minimum slack. Completion delays to jobs in the minimal slack chain may result in the delay feeding through to the final job in the chain. Individual jobs contributing the greatest time to the chain can be also identified and targeted for performance improvement to reduce overall schedule runtime.
Note: Explorer and Tidal Automation approach CPA from two completely different directions. Explorer performs CPA based on the actual (static) historic job run data. Tidal dynamically predicts the critical path of a running schedule in real time. Real time prediction is based on future estimates of completion times that are therefore subject to dynamic changes affecting system performance such as: priorities, system resources and interrupts. This means that the CPA results produced by each approach are not equivalent and may be different.
Critical Path Analysis (CPA)
Explorer CPA performs a network analysis backward in time from a final job through all dependency and parent group relationships to one or more initial predecessor tasks. At each trace step a relationship link is added to build up a Chain of relationships from the final job to an initial predecessor. An initial predecessor is found when no additional relationship tracing can be performed beyond that predecessor. A chain is comprised of the ordered set of job and dependency relationships between the final job and an initial predecessor.
Note: Chain tracing stops when a traced job has a time window that constrains the job to run at a time. No additional dependencies met before the run window time are traced in this case.
Multiple relationship chains can be traced that connect a final job to one or more initial predecessors. A Chain Set is comprised of all chains having the same final job.
CPA may analyse thousands of relationship chains in large/complex job run trees. Each unique chain of relationships is compared against the other chains to determine if it is a Critical Path Chain
The Critical Path (CP) Chain for a chain set has these characteristics when compared against the other chains in the set.
-
It has the minimum aggregate slack summed across all relationships in the chain.
-
When multiple chains in a chain set have the same slack then the chains are further ranked using the sum of the job wait and run times for all jobs in the chain.
-
Completion delays to a job in CP Chain will typically result in the delay feeding through to the final job in the chain
When CPA analyses a group containing multiple final jobs (and therefore multiple chain sets), then the chain sets are ranked based upon the completion time of the associated final job, later completing jobs are ranked higher than earlier jobs.
The CP chain can be further analysed to rank the jobs in the chain in terms of their individual time contribution to the overall chain time span. The job(s) contributing the most time to the CP chain would typically be targeted for performance improvement to reduce the overall time associated with that chain.
CPA Worked Example
These simple example has a final Job-D that depends on Job-B and Job-C completing normally and Job-B and Job-C that depend on Job-A completing normally. The overall elapsed time for the job steam is 12 minutes.
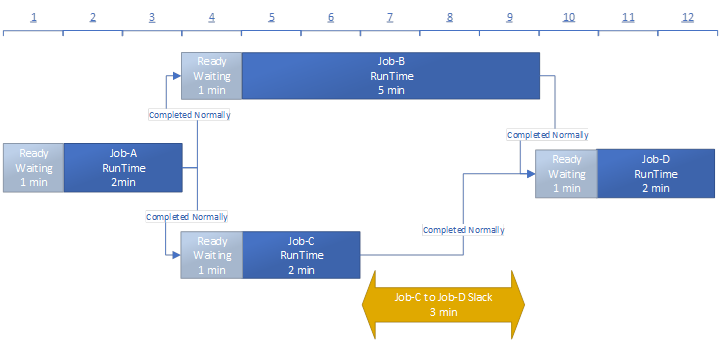
There is one final job, Job-D, resulting in a single Chain Set.
The Chain Set contains two chains X and Y:
-
Chain X is comprised of two links: Job-D > Job-B and Job-B >Job-A.
-
Chain Y is comprised of two links: Job-D > Job-C and Job-C >Job-A.
Each job contributes two time components to the overall chain elapsed time; Time the job spent Waiting for Resources and time spent Running.
Chains X and Y have the same duration (because they have the same start and end job) calculated as Chain-X Duration = Job-D EndTime (12min) – Job-A Ready (0min)
OR
Job-A (1+2) 3 mins + Job-B (1+5) 6 mins +Job-D (1+2) 3 mins = 12 mins
Slack is a calculated time span property for each dependency relationship used by a job.
Slack[dep] = Job Ready Time – MetTime[dep]
Where:
MetTime is the time recorded by Tidal for each dependency relationship used by a job and is the time the dependency relationship was met.
Job Ready Time is the time when a jobs dependency relationships are sufficiently met to allow the job to enter the ready state and start waiting for resources.
The Slack for the Job-C>Job-D relationship is calculated as Slack(job-C > job-D) = Job D Ready Time – Job-C MetTime
= 9 min – 6 min
= 3 min
The Slack for Job-B > Job-D would be approximately 0 min. Therefore, the most critical Chain (the CP chain) would be Chain X (Job-D > Job-B >Job-A) with slack = 0.
The CP chain can guide schedule optimization efforts by identifying jobs that contribute the greatest time to the critical path. In this case, Job-B makes the greatest time contribution (1 min waiting and 5 min running) = 6 min and could be investigated to identify performance optimization to reduce overall schedule duration. Also, Job-C could be delayed by up to 3 minutes without impacting the overall chain duration.
Chains X and Y are given a ranking relative to other chains, where the most critical chain X is ranked 1.
Controlling CPA using Analysis Settings
The Analysis Settings view contains a Critical Path Analysis tab to constrain the CPA processing performed and results displayed.
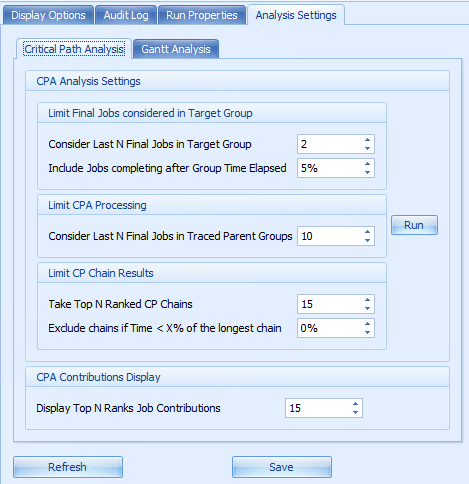
Limiting the Final Jobs Considered for CPA when run on a Target Group
In the context of CPA, a final job is the end job in a chain and must be a normal (non-group) job. If a group is selected for CPA, the final jobs in the target group are identified as those that completed normally and have no successors within the group. A group may contain multiple final jobs. For large or complex groups use these settings to restrict the number of final jobs considered for CPA and focus on those that end latest in the group. These settings only apply when CPA is initiated for a Group Job.
Consider Last N Final Jobs in Target Group:
-
Limit the number of final jobs considered for CPA within the selected group job to the specified number. Final jobs are ranked by completion time latest to earliest. The latest completing final job in the group is always considered.
-
A large/complex group containing many final jobs can result in substantially increased CPA processing time. In such cases, the recommendation is to set the parameter value to 1 to pick the latest completing job in the group. Alternatively, select a specific normal job in the Gantt view as the CPA target rather than selected the containing group.
-
When CPA is running for multiple final jobs the CPA progress UI supports user cancellation of the current analysis and display of the partial results based on the final jobs analyzed prior to the cancellation operation.
Include Jobs completing after Group Time Elapsed:
-
Restrict the final jobs considered for CPA within the selected group to include only those completing after X% of the group overall duration has elapsed. The latest completing final job is always considered. This filter only applies if the parameter value is > 0%
Limiting the CPA Processing
Consider Last N Final Jobs in Traced Parent Groups:
-
Limit the number of final jobs in a parent group considered by CPA when tracing back. Final jobs in a traced parent group are ranked by completion time latest to earliest. The latest completing final job in the parent group is always considered. Final job candidates other than the latest completing job are further excluded if they have no direct predecessor relationships.
-
The CPA summary document view contains information about the number of final jobs skipped during the last CPA performed together with guidance on the parameter value required to avoid skipping the final jobs.
-
Reducing the parameter value may reduce the number of chains processed at expense of accuracy of the processing results.
-
Increasing the parameter value may increase the number of chains processed at the expense of increased processing time.
-
Applies to all CPA processing runs.
Limiting the CPA Results Set
CPA may process thousands of chains and it can be useful to limit the result set displayed.
Take Top N Ranked CP Chains
-
Restrict the results produced by CPA to the top N ranked CP chains.
Exclude chains if Time < X% of the longest chain in the chain set.
-
Exclude chains with ChainDuration < X% * MaxChainDuration
Click Run to run or re-run CPA using the current settings against a Target Gantt task which is identified using these rules:
-
Use the previous target task if a CPA analysis exists or
-
Use the current selected Trace target task if it exists or
-
Use the current focused task in the Gantt view.
CPA can also be initiated for the currently focused task in the Gantt view using CPA action in the Gantt context menu.
Note: The CPA target task must be a group or normal job that has completed normally.
CPA Contributions Display
Display the Top N ranked Job Contributions
-
Display the Top N job contributions in the Contributions chart for the selected chain. Changes to this setting are applied dynamically to an existing CPA analysis.
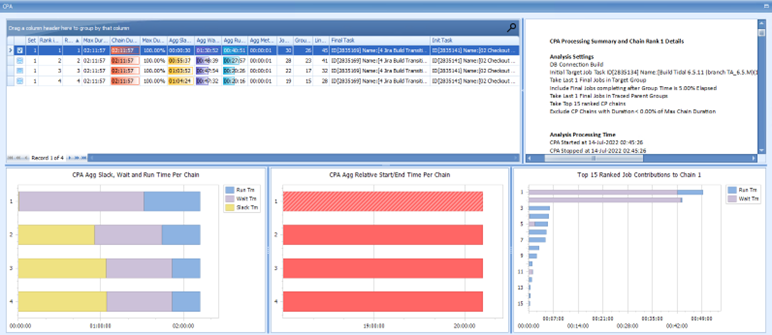
Critical Path Results
The analysis results for CPA are displayed in the CPA view comprising five views laid out in two rows.
-
Top Row Left: Top N Ranked CPA Chains Grid
-
Top Row Right: CPA Processing Summary document
-
Bottom Row Left: CPA Agg Slack, Wait and Run Time per Chain Chart
-
Bottom Row Middle: CPA Agg Relative Start/End Time per Chain Chart
-
Bottom Row Right: Top N Ranked Job Time Contributions for the selected chain Chart.
Splitter controls allow vertical resizing of the top and bottom rows and horizontal resizing of the views in each row. The vertical splitter in the top row can also expand/collapse the CPA processing summary document section.
When CPA is initially run the tasks associated with the Top Ranked CP chain (rank 1) are color highlighted in the Gantt view in red.
Note: Use the Display Options: Advanced Filters > Critical Path Filter checkbox to display the critical path tasks and relationships on the Gantt view for the CP chains checked in the CPA results grid.
Top N Ranked CPA Chains Grid
The CPA grid displays the Top N CP chains in rank order. Selecting a row updates the Job Time contributions chart for that chain and highlights the associated chain in the CPA Agg relative Start/End chart.
The grid has a context menu that supports these CPA specific actions for the chain associated with the selected grid row:
|
Selected Chain Row Context Menu Items |
Description |
|---|---|
|
Update Selected Chain in Processing Summary |
Update the CPA Processing Summary to display the detailed information for the associated chain. |
|
Export Selected Chain Detail to Excel |
Export the CPA summary information and detailed chain information for the associated chain to excel. Note: The Excel Export ChainLink sheet includes additional fields such as ‘IsTargetSource’ to help Tidal Support diagnose queries relating to the tracing performed by the CPA. |
|
Print Selected Chain Results |
Print the CPA Processing summary information, the detailed chain information for the associated chain and the CPA charts to PDF or Excel. Issue: Using the Export Document to PDF action in the Print preview control may not export the CPA chart information to the PDF file. |
Press Ctrl+P when the mouse is focused in the grid to Print/Export the grid data.
The grid displays these information for each chain:
|
Columns |
Description |
|---|---|
|
Highlight Chain |
Highlight Checkbox. Check the color highlight the tasks and relationships associated with this chain in the Gantt view in red. Uncheck to remove color highlighting for this chain from the Gantt View. This checkbox works in conjunction with the CPA filter in the display options. |
|
Set |
The Chain Set number for this chain. Chains in the same chain set have the same final task. Chain Set 1 contains the Rank 1 chain. |
|
Rank In Set |
The rank of this chain relative to other chains within the same Chain Set. |
|
Rank |
Overall rank of the chain relative to all chains identified in CP analysis. |
|
Max Duration |
Duration of the chain with the maximum elapsed time in the current chain set in HH:mm:ss format. Note: A ranked Critical Path chain may have a shorter elapsed duration than the chain with the maximum duration in the chain set. |
|
Chain Duration |
Total elapsed time covered by the chain from the start of the initial task to the end of final job in HH:mm:ss format. Uses bar color coding to indicate length of Chain Duration relative to other chains. |
|
Max Durn % |
Ratio of this Chain Duration / Max Chain Duration associated with the current chain set. |
|
Agg Slack Tm |
Sum of the slack in all relationships in the chain in HH:mm:ss format. Uses bar color coding to indicate size of Agg Slack Tm relative to other chains. |
|
Agg Wait Tm |
Sum of the job wait times contributing to the chain from all relationships in the chain in HH:mm:ss format. Uses bar color coding to indicate size of Agg Wait Tm relative to other chains. |
|
Agg Run Tm |
Sum of the job run times contributing to the chain duration from all relationships in the chain in HH:mm:ss format. Uses bar color coding to indicate size of Agg Run Tm relative to other chains. |
|
Agg Met Delay |
Sum of MetTime delays from all relationships in the chain in HH:mm:ss format. Occasionally, TA may record the MetTime at a time later than when the predecessor dependency was met. CPA marks this time as a MetTimeDelay. |
|
Job # |
Number of normal jobs in the chain. |
|
Group # |
Number of group jobs in the chain. |
|
Link # |
Number of relationship links in the chain. |
|
Initial Task |
Information about the initial task in the chain. |
|
Final Task |
Information about the final task (normal job) in the chain. |
|
Initial Task Start |
Time the initial task started (not displayed by default). |
|
Final Task End |
Time the final job completed (not displayed by default). |
|
Slack Tm % |
Ratio of Agg Slack Tm/Chain Duration Tm for this chain (not displayed by default). |
|
Wait Tm % |
Ratio of Agg Wait Tm/Chain Duration Tm for this chain (not displayed by default). |
|
Run Tm % |
Ratio of Agg Run Tm/Chain Duration Tm for this chain (not displayed by default). |
Missing or Unaccounted Time. The time sum of the CPA aggregate values (Agg Slack Tm, Agg Wait Tm, Agg Run Tm, Agg Met Delay) may not fully equal the Chain duration. This missing or (unaccounted time) should be a small percentage value and is displayed as a missing % in the tooltip on the CPA Agg Slack, Wait and Run Time Chart.
CPA Agg Slack, Wait and Run Time Per Chain Chart
Displays a stacked bar showing the Aggregate Slack, Wait and Run times for each chain. The bars are presented in Rank order and correspond to the rows in the CPA grid. Hover over a bar to get tooltip summary information on that chain. Double click on a bar to select the corresponding row in the Grid and display the Job Contributions chart for that chain.
CPA Agg Relative Start/End Time Per Chain Chart
Displays a single bar showing the relative start and end time for each chain. The bars are presented in Rank order and correspond to the rows in the CPA grid. Hover over a bar to get tooltip summary information on that chain. Double click on a bar to select the corresponding row in the Grid and display the Job Contributions chart for that chain.
Top N Ranked Job Time Contributions for the Selected Chain.
Displays the Top N Job Time contributions for the normal jobs making up the chain. Each normal job has a Wait and Run contribution that are displayed as stacked bars. Use the ‘Display Top N Ranked Job Contributions’ control in the CPA Analysis Settings view to dynamically change the number of jobs displayed. Hover over a bar to get tooltip information for the job of interest. Details of the actual job Wait and Run time contributions for a chain can be viewed in the Processing summary view or in the Excel export from the Grid.
CPA Processing Summary Document
A read only document comprising two sections. The top section contains a high-level summary of the CPA processing describing the settings used, the target job, analysis processing timing, the final jobs processed and summary results. The bottom section contains detailed information for one of the Ranked Chain produced by the analysis. The default chain displayed is the Top ranked 1 chain.
The chain specific detail includes these sections:
-
High level summary info for the ranked Chain
-
List of relationship links comprising the ranked Chain in time reverse relationship order Last Link to First Link
-
List of Jobs that contribute Wait+Run time to the ranked CPA chain in Contribution Rank order.
The ranked chain displayed in the document can be updated using the ‘Update Selected Chain in Processing Summary‘ menu action in the CPA results grid.
Use the Ctrl+Mouse Scroll to zoom in/out the document contents.
Press Ctrl+S when the focused on the document to save it to rtf, docx or pdf.
Job Run Output Dialog
The Show Job Run Output dialog supports display and search of the run output of a specific job run. It is accessible from the Explorer applications context menus for UI elements that represent job runs including the Job Run Search Tool, Run Analysis, Gantt View and Reports that display specific job runs.
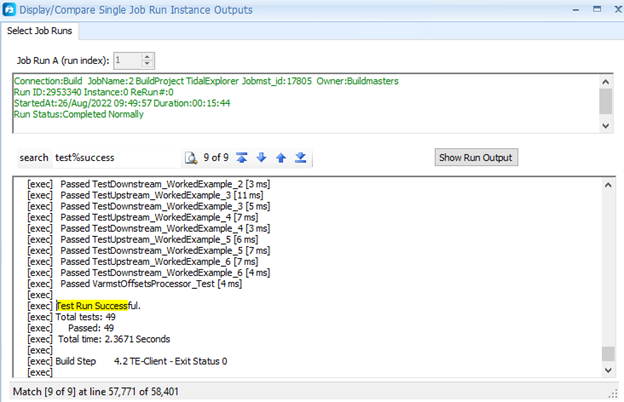
In this case, the job run selected has a single run and so the dialog displays a single Select Job Runs tab.
Click Show Run Output to display the job run output if it exists in the database together with the line count and character count in the status bar in the dialog.
Search for instances of text in the output as follows:
-
Enter the text to be matched in the search textbox. The text can contain the wild card characters.
‘%’ percentage to match any string of 0 or more characters.
‘_’ underscore to match any single character once.
-
Click Search to find matches in the output. The number of matches found is displayed and the output highlights the first found match.
-
Use the navigation buttons; First Found, Next, Previous and Last Found to navigate the matches in the output.
The job run output displayed can be saved to .txt or .rtf formats. Right-click on the output panel and click Save to File.
If a job run had re-runs, then an additional Compare Selected Job Run Outputs tab is displayed. This function supports comparison of the individual job re-run outputs for the selected job. Select the indices of the run outputs to be compared and select Compare Run Outputs to view side-by-side differences between the job run outputs.
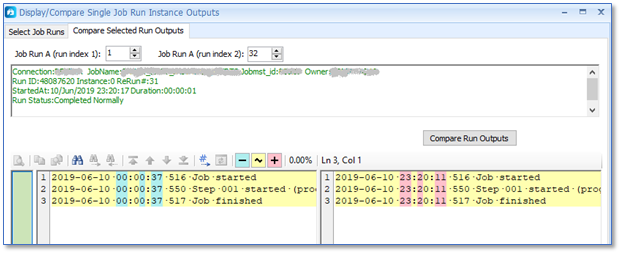
Note: Job Run Output relies on the job runs outputs being saved to the DB for the Job.
If a Jobs Run Outputs are Replaced in Tidal, only the last rerun output is available for display.
Comparison of Multiple Re-Run outputs for a Job requires the Jobs Run Outputs to be Appended in Tidal. If a job’s run outputs are not Replaced or Appended, then no output is available for display. Job Run Output is only available for normal Jobs (not Group Jobs).