Reports Accessed from Application Context Menus
Job Run Duration Analysis
The Job Run Duration Analysis report lets you visualize job run durations and relative Start and Stop times for a specific job over a period.
This report is accessible from the Explorer applications context menus for UI elements that represent jobs. It is also a drill through report for other reports such as the ‘Jobs Run in Period’ and ‘Jobs Run Duration Trend Analysis’ reports. The examples below show some of the ways the report can be run for a specific job.
Run From a Job Browser
From the Job Browser, click a Job tree node in the Job Tree and right-click to access the context menu for that job.
Run From a Job Graph
Select the Job tree node in the Job Tree in the Job Browser and right-click to access the context menu for that job.
|
Report Filters |
Description |
|---|---|
|
From Date To Date |
Filter Job runs that ran between the two supplied date times. Time format is HH:mm. |
|
Run Status |
Filter job runs based on the run status. |
|
Outlier Z-Score |
A Z-score of 3 means treating any data point as an outlier if it is more than 3 standard deviations away from the average of the data. 0 < z-score < 4.5 [default = 3] |
|
Job |
A read only box showing the full name of the job being analysed. |
Note: Only jobruns that have an Actual Start Time are shown in the report.
Report Content
The report displays a Summary, a Relative Durations chart, a Data Summary grid, A start/stop time chart, Status and SLA Pie charts and a Details table:
-
Report Summary – Shows the selected connection and the filter values supplied.
-
Relative Run Durations chart – Displays the Job Run duration data and the data series.
-
Duration – Job Run Duration data.
-
MA10 – Moving average fit to the duration data.
-
Regession – Linear regression line fits the duration data.
-
Reruns – Display a column to indicate where a job run had reruns.
-
Outlier bounds – For the data (the yellow shaded region).
-
Data Summary Statistics grid – The summary table presents statistics for the job run displayed.
Columns
Sortable
Description
Count
No
Total number of jobs run in the data.
Duration Slope (Sec/Run)
No
The slope of the linear regression fits the data. A positive slope value indicates a slowing trend for the jobs runs over time. A slope value of 65 would indicate that the job is, on average, taking 65 seconds longer on each subsequent run.
Max Duration
No
Maximum run duration HH:mm:ss.
Min Duration
No
Minimum run duration HH:mm:ss.
Avg Duration
No
Average run duration HH:mm:ss.ttt.
One StdDev
No
The calculated value of one standard deviation based on the duration data.
Z-Score
No
The Z-score used to identify outliers.
-
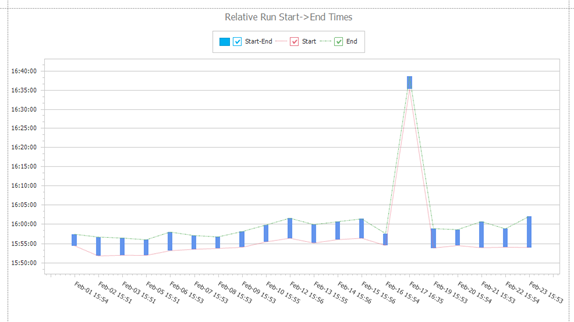
Relative Run Start > End Times chart – Shows the relative Start and End times for the Job Runs via these series.
-
Start-End – A vertical block covering the start to end time for each run.
-
Start – A line that connects the start times for the jobs.
-
End – A line the connects the end times for the jobs.
-
Job Status pie chart – Shows the ratio of runs based on job status.
-
Effective SLA summary pie chart – Shows the ratio of runs based on the Effective SLA status for each job. The Effective SLA is the most pessimistic SLA status which encompasses the job-level and any/all system-level SLA rules for a given run.
-
Details Table – Shows the job run details.
Columns
Sortable
Description
TE Action
No
TE action star to access the Explorer Application Menus for this job run.
Example: You can access the 'Job Run Output' or ‘Job Run Gantt’ reports as well as the standard job related menu options.
Row
Yes
Row number for each row returned based on the initial sorted results.
jobrun_id
Yes
Jobrun_id for the job.
instance
Yes
Instance number for the job.
rerun #
Yes
No of reruns for the job run.
Start Time
Yes
Start time of the job run.
End Time
Yes
End Time for the job run.
Duration
Yes
Duration of the Jobrun in hh:mm:ss. If the job run duration is treated an outlier based on the calculated threshold, then the duration is highlighted in yellow.
Status
Yes
Completion status for the Job run.
Effect SLA
Yes
Effective SLA status for the job run.
SubTree Run Stats
No
If the job run is a group job containing child jobs, (a tree or subtree), this column presents summary information about the child job runs in the subtree.
-
Depth: The depth of the tree relative to this job.
-
Instances: The number of job run instances in the subtree.
-
Rerun: Total of all job re-runs in the subtree job runs (display is optional).
-
Interventions: Total Count of operator job run interventions detected in the subtree job runs (display is optional).
-
Trace Job Dependencies and Job Successors Reports
There are two complementary reports: Report Job Dependencies and Report Job Successors that allow reporting and tracing of direct and indirect job dependency and job successor chains respectively.
The reports are accessible from the Explorer applications context menus for UI elements that represent jobs. See the examples shown in Job Run Duration Summary for more information. The example below is based on accessing the reports from a Job Graph.
Report Content
The diagram shows:
-
On the left-hand side, a job graph showing Traced Job Dependencies and Successors starting from an origin job named Job-BC.
-
On the upper right-hand side, a Job Dependencies Report run via the context menu ‘Report Job Dependencies’ for Job-BC.
-
On the lower right-hand side, a Job Successor Report run via a context menu Report Job Successors for Job-BC.
Both reports display a Text Summary, and a Detail Table:
-
Text Summary. Shows the information about the selected job and the depth of the tracing.
-
Detail Table. The table lists the job dependencies (or successors) relationships by trace depth starting from the origin job.
The relationship results are grouped by trace depth from the origin.
Each relationship row shows the dependency or successor relationship between the jobs. Each job at either end of the relationship is displayed using jobmst_id and jobpath.
The jobmst_id is also an action button (indicated by the blue link) that allows the application context menu for that job to be accessed.
Job Run Gantt Report
The Job Run Gantt report shows a basic Gantt chart view for a specific job run. It is accessible from the Explorer applications context menus for UI elements that represent job run. We recommend using the ‘Job Run Gantt and Trace Analysis’ tool for Gantt visualization and printing. This report will be removed in a future release.
Report Content
The report displays a Text Summary and a Gantt Chart.
-
Text Summary. Shows the information about the selected connection, job and job run. The parent name of the job is displayed as an action button given access to the context menu for the parent job.
-
Job Run Gantt Chart. The row elements of the Gantt report represent job runs. Each element in the row: job name, status or bar graphic can be:
Mouse hovered to show tool tip information about that job.
Selected to access job and job run context menu actions for that job.
Using the Original Report Viewer Dialog
Tidal Explorer reports are displayed using two different Report Viewer Dialog types, an original viewer and new viewer, introduced in Explorer 3.1.5. The original report viewer will be phased out in future releases. This section describes the use of the original Report Viewer dialog.
Original Report Viewer – Top Menu [Top]
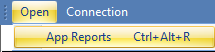
Open > App Reports
Opens the Application Report Selection dialog to select a different report be displayed. If the selected report supports the original Report Viewer then it is opened in the current viewer, otherwise the selected report will open using a new Report Viewer dialog.
Connection > Change
Changes the DB connection being used with this report. Changing the connection reloads the report definition and populates the parameters, and resets to default values.
Original Report Viewer – Parameters and View Button Area [Top Mid]
This section shows the parameters to be used to filter the report. The panel uses a flow layout to reduce the vertical space used by parameters if horizontal space can be used. The parameter panels vertical height can be adjusted using a grab bar at the bottom of the panel.
Change the filter parameters as required then click View to query the connected database for the report data. An animated overlay appears on the report form to prevent further interaction until report data is returned from the database.
Note: Clicking View after the report is rendered will re-render the report but will not re-query the database unless at least one parameter has been changed since the last report run.
The overlay is removed when the report data has been returned from the DB and the viewer starts rendering the report. In this rendering phase, another graphic is displayed.
Original Report Viewer – Control Bar
The Report viewer control has a toolbar containing functions that allow you to page forward and backward through paged reports. The total number of pages isn't not displayed. Instead, a number and question mark indicate that additional pages are present.
Paging Control Actions

Back to Parent Report Action

The Back to Parent button is active if the current report is child of a parent report. Selecting this action returns to the parent report.
Stop Rendering Action

The Stop Rendering button is active if the current report is being rendered. Selecting this action stops the current rendering operation.
Refresh Render Action

Clicking this refreshes the current rendered report using the loaded report data. Note that it does not re-run the database query.
Print/Export Actions

Print Action
Displays a print dialog to print the report.
Print Layout Action (toggle)
Displays a view of the printed report when toggled on. You can use Page Setup to increase the paper size or change orientation. The layout updates to show the effect of the page setup on the report layout.
Page Setup Action
Displays a Page Setup dialog that lets you change paper size and paper orientation.
Export Action (drop down)
Displays drop-down menu options to export the report to Excel, Word or PDF.
Note: When exporting to PDF, the Report viewer control does not take account of the page setup that is defined in the viewer control. These workarounds are possible once the appropriate page size and orientation has been configured for the report.
-
Use the Print Action and click Print to PDF from the printer types.
-
Use the Export to Word Action and Export to PDF from the Word document.
Zoom Action (drop down)

Displays drop-down menu options used to change the zoom level.
Find Text in Report Actions

Find Text (TextBox)
A textbox used to enter text to be found in the report.
Find Action
Finds the first instance of specified text in the report.
Next Action
Finds the next instance of text in the report.
Report Display Panel
The display area where the report is rendered.
Connection Status Control [Bottom]
Displays the current DB connection associated with the report form.
Using the New Report Viewer Dialog
Tidal Explorer reports are displayed using two different Report Viewer Dialog types, an original viewer and new viewer, introduced in Explorer 3.1.5. The original report viewer will be phased out in future releases. This section describes the use of the new Report Viewer dialog.
The dialog comprises these elements:
New Report Viewer - Top Menu [Top]
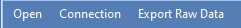
Open
Opens the Application Report Selection dialog to select a different report be displayed. If the selected report supports the new Report Viewer, then the previous report is closed and the selected report is opened, otherwise the selected report will open using an original Report Viewer dialog.
Connection
Changes the DB connection being used with this report. Changing the connection reloads the report definition and populates the parameters, and resets to default values.
Note: The Connection command option is disabled when viewing reports that relate to a specific job.
Export Raw Data
Exports the raw data used by the report to Excel.
New Report Viewer – Parameters and View Button Area [Left Hand Side]
This section shows the parameters to be used to filter the report. The panel can be docked, resized, and closed.
Change the filter parameters as required then click Submit to query the connected database for the report data. An animated overlay appears on the report viewer to prevent further interaction until report data is returned from the database. After the data has been returned from the database a progress bar with a Stop button is displayed in the Status Bar at the bottom of the Viewer to track creation of the report document. Click Reset to reset the parameters to the default values.
New Report Viewer – Control Bar
The New Report viewer control has a toolbar containing these functions.
Show/Hide Parameters Panel

Gives the ability to show or hide Parameters Panel.
Show/Hide Page Thumbnails

Gives the ability to show or hide Page Thumbnails.
Show/Hide the Find Text in Report panel

Displays a Find Text in the report content when active.
Printing Options

Displays a Print dialog allowing printing the report.
Page Setup

Displays a Page Setup dialog to change paper size, orientation, and margins.
Scaling Options

Displays a dialog to adjust the report content scaling to fit pages.
Hand Tool

Scrolling of the report document using the mouse is enabled when the tool is active.
Zoom Control Actions

The zoom level can also be adjusted using the zoom control in the right of the Status Bar at the bottom of the Report Viewer.
Paging Control Actions

Page Navigation controls the page through the report content. The current page and total page count is displayed on the left of the Status Bar at the bottom of the Report Viewer.
Multiple Pages

Displays multiple pages of the report when active.
Watermark

Opens a dialog that supports addition of a watermark to the report.
Export Document

Exports the current report document to a file using one of these formats: PDF, HTML, MHT, RTF, DOCX, XLS, XLSX, CSV, TEXT or Image file.
Report Display Panel
The display area where the report document is rendered.
Status Bar [Bottom]
Displays status information including rendering progress, page counts and zoom control. The Status Bar can be hidden/shown by checking the Status Bar context menu option on the Control Bar.
Performance Tips when Running Reports
Report performance depends on several factors such as data volume in the database tables that are queried, and the parameters used to filter the result set.
Timeout Errors
In some cases, a report query to the database may exceed the default command timeout set for that database. This can be verified by checking the Explorer Service log file if the report fails.
Use report filters to reduce query time and size of the results set
Filter the report to reduce the query time and the results size. This is always the preferred option to reduce the query duration via the report filters.
Increase the Command timeout for long running queries
If additional filtering is not feasible, you can increase the command timeout above the default or built in duration.
The default query command timeout is normally 30 seconds. This default can be increased as follows
-
By the Explorer Administrator using the Admin tool for any database.
-
For queries run by a specific Explorer Client, you have the option to increase the command timeout using the Settings > Options > SQL Options > Long Running Sql Command Timeout setting.
Increasing the default command timeout can also be helpful when backup databases have been restored to servers that are running on lower spec VMs.