SLA Analysis
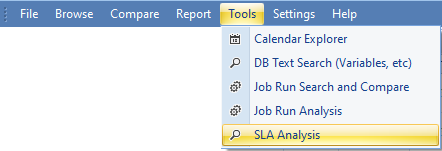
The SLA Analysis tool supports analysis of SLA results for job runs associated with SLA policies and Job-specific SLA constraints over a period of time. SLA search results are presented in summary and detailed formats. Drill through from summary results to view historical SLA trend charts and then to job run Gantt views for comprehensive top to bottom analysis. The menu option is available from the Tools menu when Explorer connects to databases for Tidal 6.5.6 or higher.
The displayed SLA Analysis Tool has four main window components:
-
A top toolbar containing; a DB selection dropdown, a Details Auto Filter toggle button, a Print with Options button and a Load/Save SLA Analysis menu.
-
An SLA selection/filter control on the left-hand side
-
Three vertically stacked SLA search results panels on the right-hand side
A grid that summarizes the SLA search results per Job/SLA rule (top).
A chart that displays analysis views for the currently selected row in the summary grid. A grid that displays the detailed SLA job runs search results (bottom).
The filter and SLA results windows can be dragged/dropped into different layout configurations within the parent Analysis Control.
The results grids support column selection, filtering, grouping, re-ordering, text find, and embedded navigation.
SLA Selection/Filter Control
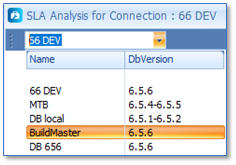
Select a target DB with a version greater or equal to 6.5.6 using the DB selector control.
The SLA/Filter Control displays these controls:
|
Search Filters |
Description |
|---|---|
|
From Date To Date |
Search for SLA-related job runs within the date range of interest. |
|
Include Job Specific SLA Runs |
|
|
Exclude Runs with no SLA Events |
|
|
Exclude Future Jobs |
This checkbox is only visible if the filter date range of interest includes or exceeds the current production date for the connected DB. |
|
Tags |
A read-only text area displaying the list of tags currently checked in the SLA Policy to Tag Tree view. |
|
Apply |
Button – Searches the selected DB using the current filter settings and displays the results in the results views. |
|
SLA Policy Rules and Tags |
Tree view with checkboxes showing the SLA Policy, Rules, and Tags hierarchy. SLA Policy → SLA Rule → Tags and Count of jobs that reference that tag. Checking/Unchecking any node in the Tree view will check/uncheck all nodes in the subtree for that node and update the list of Tags selected accordingly. Pressing Ctrl when Checking/Unchecking a node checks/unchecks only the specific Node. |
Printing/Exporting the SLA Search Results
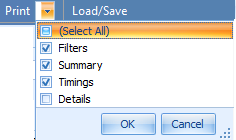
Click Print and select one or more of the available sections to include in the SLA Analysis report.
|
Print Options |
Description |
|---|---|
|
Filters |
Checkbox – Check to include the applied filters in the report. |
|
Summary |
Checkbox – Check to include the SLA Search summary grid in the report. |
|
Timings |
Checkbox – Check to include the SLA Timing charts in the report. |
|
Details |
Checkbox – Check to include the SLA Search Details grid in the report. |
A report document displaying the requested report content will be created. The document can be exported to multiple formats including html, pdf and docx. To print/export content in a specific results grid or chart, press Ctrl+P when the mouse is focused on the relevant control.
SLA Job Run Search Results
SLA Search Summary Grid
The Search Summary grid shows the results aggregated at the job/SLA rule level for the time period. The results only consider jobs that have completed normally and are initially ordered by breach count and use color coding to highlight SLA areas of concern.
|
Columns |
Description |
|---|---|
|
Source
|
Indicates the source of the SLA constraint:
|
|
JobName |
Full name of the job. |
|
Job ID |
ID of the Job. |
|
Policy |
Name of the SLA Policy. |
|
Rule |
Name of the SLA Rule. |
|
Run # |
Number of completed runs that had SLA events. |
|
Breached # |
Number of completed runs that breached the SLA constraint. The color bar width indicates the relative number of breached runs for this job compared to other job rows in the summary view. |
|
InRisk # |
Number of completed runs that completed in the Risk region of the SLA constraint. The color bar width indicates the relative number of in-risk runs for this job compared to other job in the summary view. |
|
Compliant # |
Number of completed runs that complied with the SLA constraint, completing before the risk or breach boundaries. The color bar width indicates the relative number of compliant runs for this job compared to other jobs in the summary view. |
|
Tag |
Tag associated with the SLA Rule for the job. |
SLA Timing Charts
The SLA Timing Chart tab displays one of three chart types which show historic job runs associated with the current Search Summary grid row selection.
The timing charts support these interactions:
-
Select the desired chart type using one of the Chart Type radio buttons.
Stacked
Duration
Margin
-
Click Rotate to rotate the current displayed chart.
-
Checking the Date Zoom control enables zooming/scrolling of the date axis in all charts. This can be very useful if the chart contains many data points.
-
Checking the Value Zoom control enables zooming/scrolling of the value axis in all charts.
-
Print/Export a chart by pressing Ctrl+P when the mouse is in the chart area.
-
Hover the mouse over a chart data point to display tooltip information about the job run and associated SLA constraints.
-
Click the mouse over a chart data point to display the Context menu for job and job run actions such as the Job Run Gantt and Trace Analysis tool.
Stacked Chart
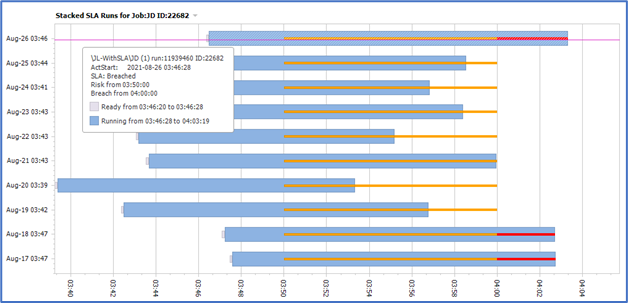
The stacked chart visualizes the relative ready, start and end times for each completed run of the SLA job in the period of interest. It also displays the relationship between the job end time and the SLA time boundaries in place for each job run.

A green line indicates a compliant job run where the line displays the margin between the end of the job run and the start of the earliest SLA boundary that applies to the job.

An amber line indicates the overlap between the risk region and the job run timeframe.
A red line indicates the overlap between the breach region and the job run timeframe.
Use the Stacked chart to detect drift in job start and end times for the job over the period of interest and assess the impact on the SLA constraints.
Duration Chart
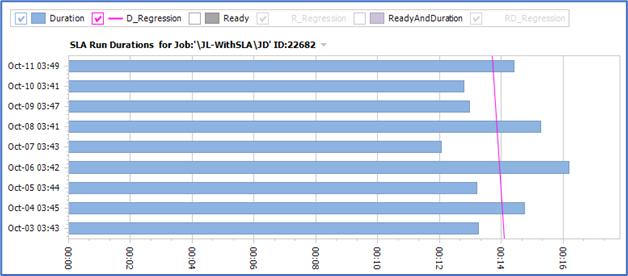
The duration chart visualizes the relative durations of three measures for each completed run of the SLA job in the period of interest and includes linear regression lines for each measure to indicate trend direction over time. The measures displayed are controlled using the checkboxes in the legend.
|
Measure |
Description |
|---|---|
|
Duration
|
Indicates the duration from the time the job was started until it completed running. Visible by default. D_Regression – A linear regression line for the Duration measure. Visible by default. |
|
Ready |
Indicates the duration from the time the job was ready until it started running. Not Visible by default. R_Regression – A linear regression line for the Ready measure. Not Visible by default. |
|
ReadyAndDuration |
Indicates the duration from the time the job was ready until it completed. Not Visible by default. RD_Regression – A linear regression line for the ReadyAndDuration measure. Not Visible by default. |
Use the duration chart to detect duration drift for job run duration and ready duration over the period of interest.
SLA Margin Trend Chart
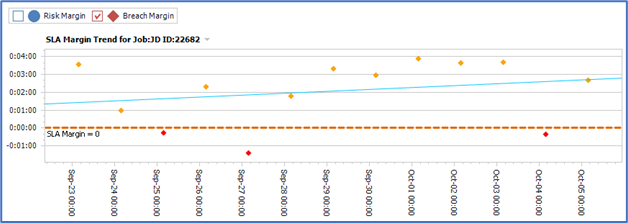
The SLA margin trend chart visualizes the trends for the SLA risk margin and SLA breach margin for job runs over the period of interest. The SLA margin is the time difference between the risk or breach boundary and the job end time. A positive SLA margin value is good, and a negative margin value is bad. The important SLA margin=0 boundary line is displayed on the chart.
The color (Green, Amber, Red) of each point displayed indicates the overall SLA compliance (Compliant, Risk, Breached) for the run.
Use this chart to track the SLA margin trends for your SLA jobs over time.
SLA Search Details Grid
The search detail grid displays the SLA Job Runs based on the applied filter settings and state of the Detail Auto Filter toggle control in the toolbar.
|
Detail Auto Filter State |
Description |
|---|---|
|
Enabled
|
When Detail Auto Filter is enabled then the Details grid displays the search results associated with the selected summary grid row. Note: User filtering in the Details grid is not supported when Detail Auto Filter is enabled. |
|
Disabled |
When Detail Auto Filter is disabled then the Details grid displays all search results. Note: User filtering in the Details grid is supported when Detail Auto Filter is disabled. |
The jobruns relate to SLA Policies and Rules via Tag relationships or jobruns that have SLA criteria defined in the Job Definition or when the job was inserted in the schedule, or that had SLA events raised against them during the job run.
|
Columns |
Description |
|---|---|
|
Prod Date |
Production date associated with the job run. |
|
Sla Src |
Indicates the source of the SLA constraint:
|
|
Run ID |
ID of the job run. |
|
Job ID |
ID of the Job. |
|
Job Name |
Full name of the Job. |
|
Job Type |
Group or Job. |
|
Start Time |
Time the Job started in HH:mm:ss format. |
|
End Time |
Time the Job ended in HH:mm:ss format. |
|
Duration |
Duration of the Job in dd:hh:mm:ss format. |
|
Run State |
Status of the job run. |
|
SLA Time Compliance |
Indicates the SLA Time Compliance of job runs that have completed.
The SLA Time Compliance considers the end time associated with the job run in relation to SLA time constraints. It does not consider completion status of the job run. |
|
Latest SLA Event |
The latest SLA event raised during the job run. |
|
Risk From Tm |
Start of the risk window for the SLA in HH:mm:ss format. |
|
Risk To Tm |
End of the risk window for the SLA in HH:mm:ss format. |
|
Breach From Tm |
Start of the breach window for the SLA in HH:mm:ss format. |
|
Breach To Tm |
End of the breach window for the SLA in HH:mm:ss format. |
|
Tags |
Tag for the job. |
|
SLA Rule |
SLA rule defined the SLA constraints used. |
|
SLA Policy |
SLA policy associated with the SLA Rule used. |
You can use the context menu in the detail results grids to:
-
View the advanced Job Run Gantt and Trace Analysis tool for the selected job run row. The Gantt view uses the SLA Risk and Breach constraints defined in the selected row.z
-
Search the run outputs for all jobs displayed in the results grid.
Loading/Saving SLA Search Results to file
Click Load/Save > Save SLA Analysis to save the current SLA Analysis results to an [*.EXSL] file.
The saved SLA analysis can be reloaded from file at a later time using the Load/Save > Load SLA Analysis menu option.